Fig. 1
Download original image
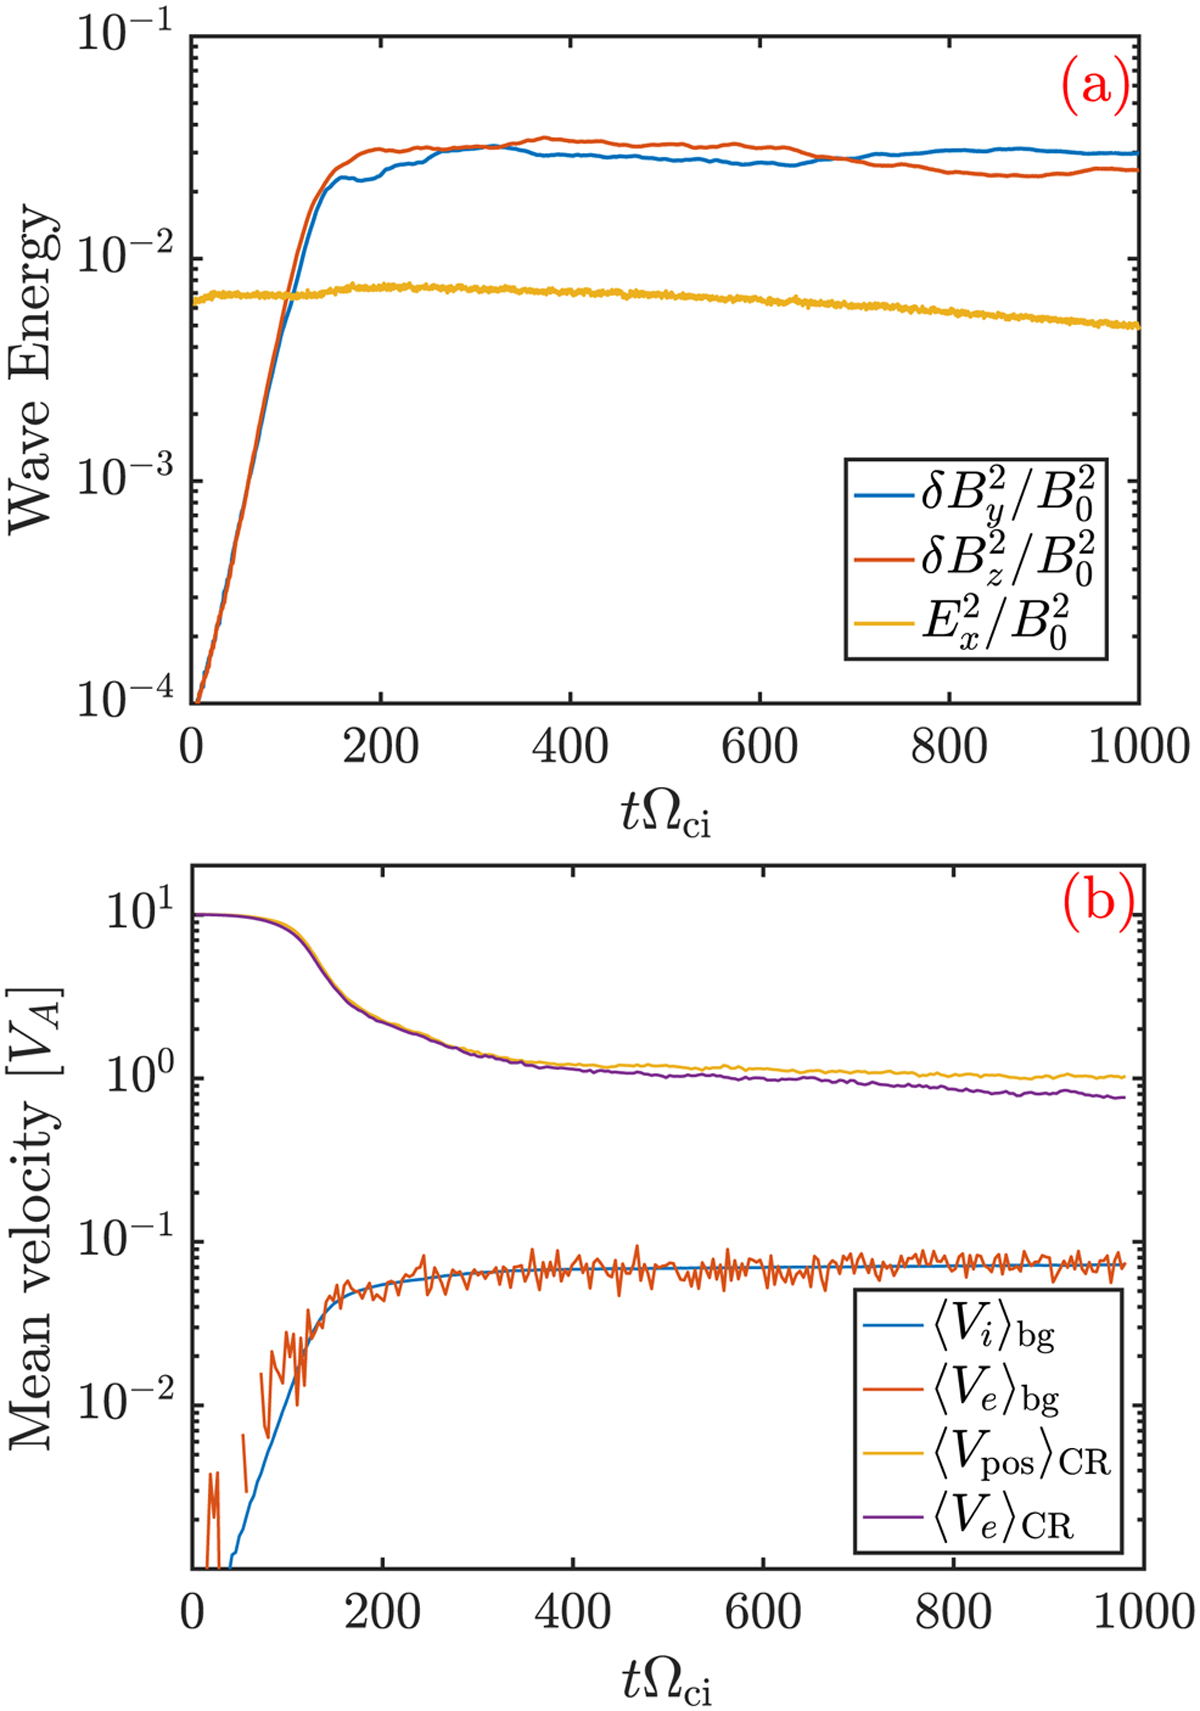
Overall evolution of the instability in time, for the Fid run. Top panel: wave energy evolution. Blue and red lines depict the evolution of transversal perturbations ![]() and
and ![]() , respectively. The yellow line corresponds to the level of electrostatic fluctuations
, respectively. The yellow line corresponds to the level of electrostatic fluctuations ![]() . Bottom panel: mean velocity evolution of different species. Blue and red lines correspond to the background ions and electrons, respectively. The yellow and magenta lines show the evolution of the drift velocity of beam positrons and electrons, respectively.
. Bottom panel: mean velocity evolution of different species. Blue and red lines correspond to the background ions and electrons, respectively. The yellow and magenta lines show the evolution of the drift velocity of beam positrons and electrons, respectively.
Current usage metrics show cumulative count of Article Views (full-text article views including HTML views, PDF and ePub downloads, according to the available data) and Abstracts Views on Vision4Press platform.
Data correspond to usage on the plateform after 2015. The current usage metrics is available 48-96 hours after online publication and is updated daily on week days.
Initial download of the metrics may take a while.