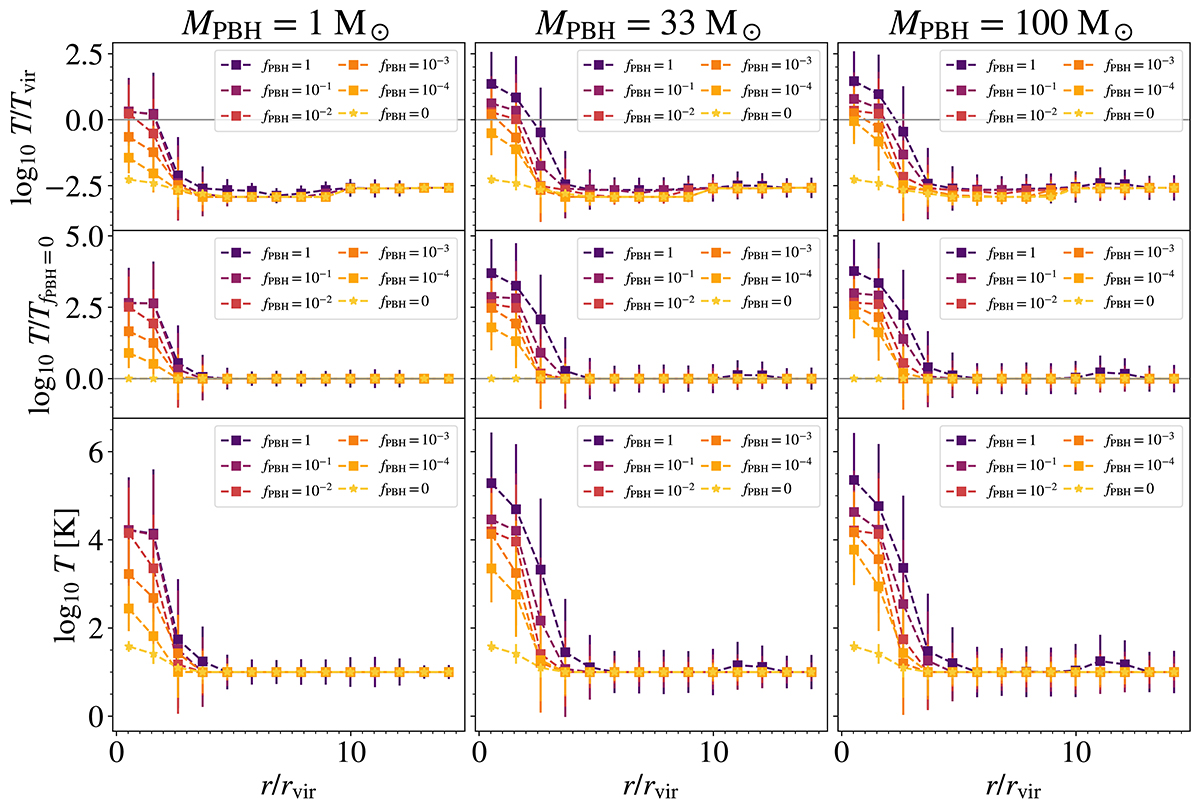
Fig. 8.
Download original image
Median temperature ratios and gas temperature as a function of distance from the halo center. From top to bottom, each row shows the median ratio of the final (i.e., after implementing our model) and the halo virial temperature, the median ratio of the final gas temperature and the gas temperature when only our cooling model is applied, and the median gas temperature. All as a function of distance from the halo center, expressed as a fraction of the virial radius. Each column from left to right corresponds to considering PBHs with masses of 1, 33, and 100 M⊙, with different fractions of DM composed of these PBHs, as indicated in each panel. For reference, we include the case of fPBH = 0, where we applied our cooling model alone. The error bars represent the standard deviation in each distance bin. Individual profiles were first calculated around each halo separately, and then the median values of the temperature ratios were derived from these individual profiles of the six halos. The virial temperatures range from 3800 to 8800 K.
Current usage metrics show cumulative count of Article Views (full-text article views including HTML views, PDF and ePub downloads, according to the available data) and Abstracts Views on Vision4Press platform.
Data correspond to usage on the plateform after 2015. The current usage metrics is available 48-96 hours after online publication and is updated daily on week days.
Initial download of the metrics may take a while.