Fig. 5.
Download original image
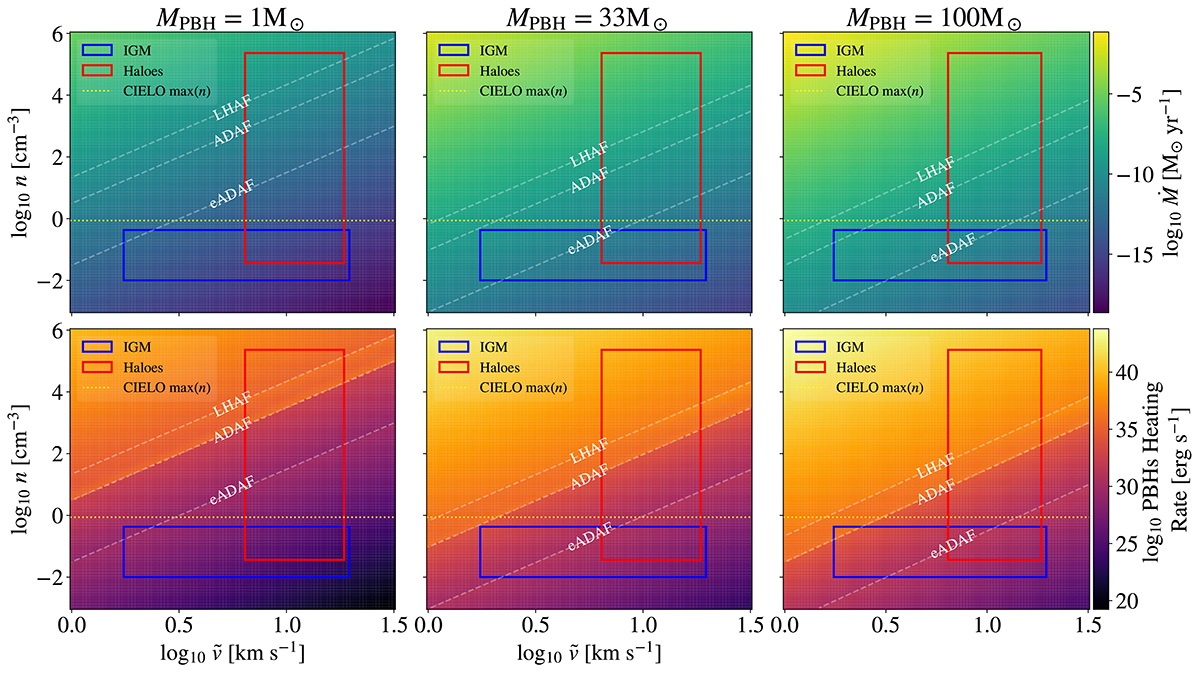
Accretion and heating rates of PBHs with varying masses in the density vs. velocity plane. The color-coded panels illustrate the behavior of PBHs with varying masses (1 M⊙, 33 M⊙, and 100 M⊙ columns from left to right) in the density vs. velocity plane, depicting the accretion rate (upper row) and the resulting heating rate (bottom row). The dashed white lines delineate the upper limits of specific accretion regimes (eADAF, ADAF, and LHAF) as shown in Fig. 1. The red rectangles enclose the density and characteristic velocity ranges around each PBH within the halos, employing a rescaled version of the gas density profiles from Liu et al. (2022) and the CIELO particle velocities. The blue rectangles encapsulate weighted values around PBHs in the IGM. The dashed yellow line marks the peak density of a gas particle in the CIELO simulation. These results are representative of gas conditions at z ∼ 23.
Current usage metrics show cumulative count of Article Views (full-text article views including HTML views, PDF and ePub downloads, according to the available data) and Abstracts Views on Vision4Press platform.
Data correspond to usage on the plateform after 2015. The current usage metrics is available 48-96 hours after online publication and is updated daily on week days.
Initial download of the metrics may take a while.