Fig. 4.
Download original image
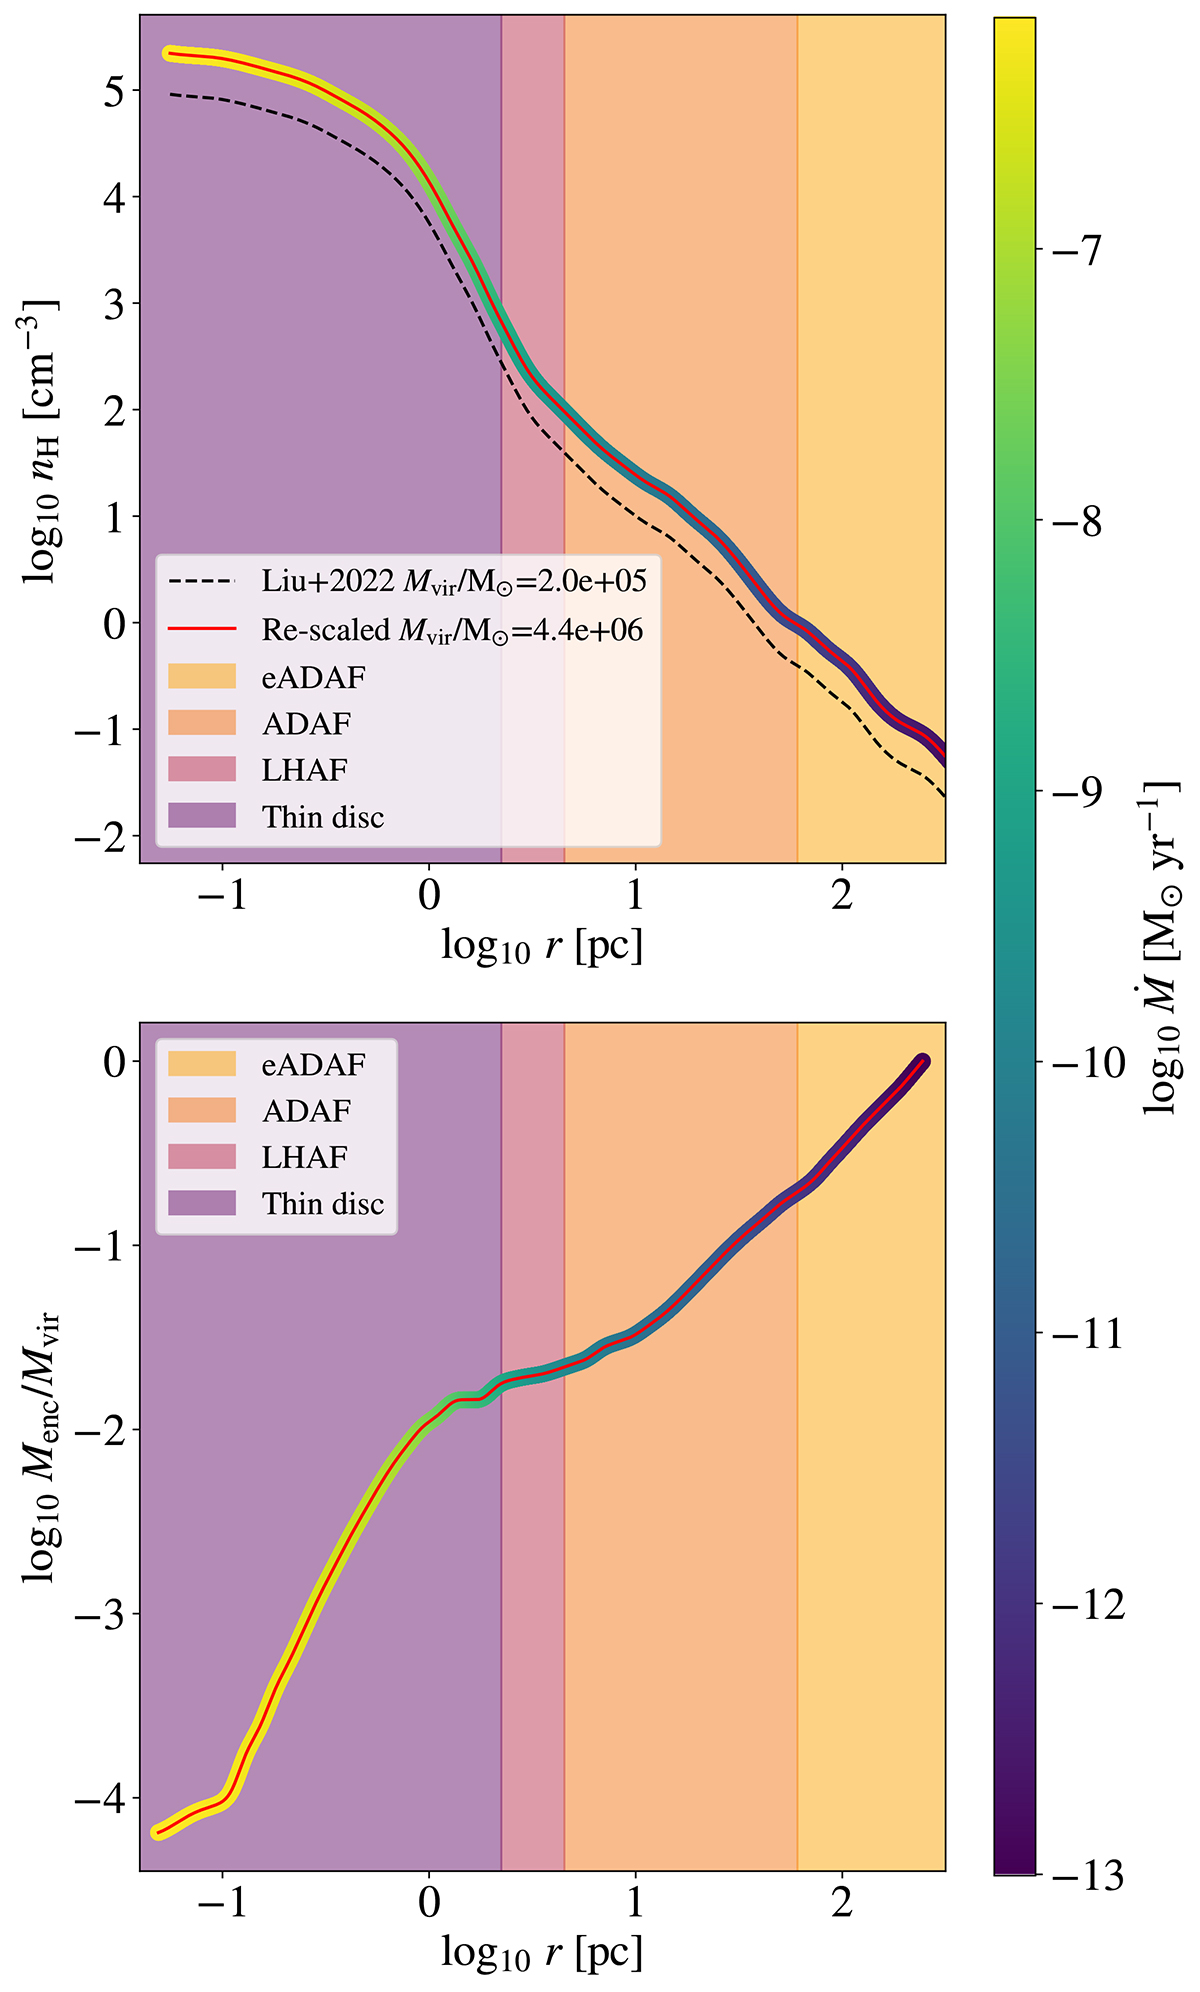
Gas density profile and enclosed mass profile for a 33 M⊙ PBH. The upper panel displays the gas density profile taken from Liu et al. (2022) (dashed black line) alongside the rescaled density profile for one of our CIELO halos (red line). In the lower panel, the enclosed mass profile over the virial mass for this halo is shown. In both panels, the profiles are color-coded based on the gas-accretion rate of a 33 M⊙ PBH. For this particular example, we set ![]() km/s and μ = 1.22, but in our implementation, these values varied depending on per-particle information from CIELO. Each panel is segmented into colored zones that align with different radii and their respective gas densities, so that the corresponding accretion mechanisms (eADAF, ADAF, LHAF, and thin disk) are active within the segments. The profiles are color-coded based on the accretion rate of the PBH.
km/s and μ = 1.22, but in our implementation, these values varied depending on per-particle information from CIELO. Each panel is segmented into colored zones that align with different radii and their respective gas densities, so that the corresponding accretion mechanisms (eADAF, ADAF, LHAF, and thin disk) are active within the segments. The profiles are color-coded based on the accretion rate of the PBH.
Current usage metrics show cumulative count of Article Views (full-text article views including HTML views, PDF and ePub downloads, according to the available data) and Abstracts Views on Vision4Press platform.
Data correspond to usage on the plateform after 2015. The current usage metrics is available 48-96 hours after online publication and is updated daily on week days.
Initial download of the metrics may take a while.