Fig. 1.
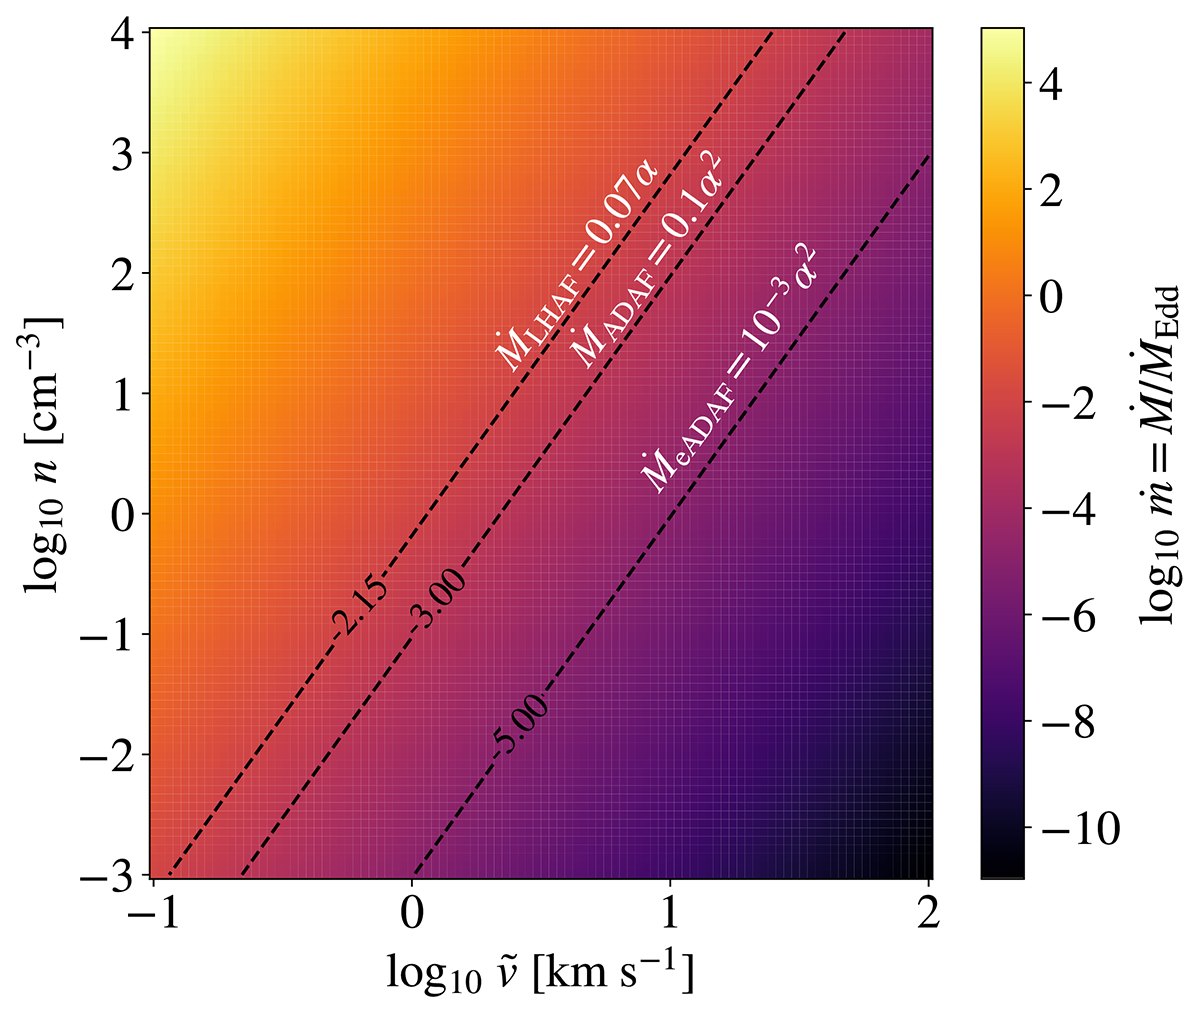
Download original image
Continuous color map of the parameter ṁ across a grid of characteristic velocities and hydrogen number densities considering a fixed PBH mass of 33 M⊙. The dashed black lines indicate the thresholds for MeADAF, MADAF, and MLHAF as a function of the viscosity parameter α = 0.1. The region above MLHAF corresponds to the thin-disk formation regime, while in the region between MLHAF and MADAF, LHAF occurs. The area between MADAF and MeADAF corresponds to the standard ADAF. The eADAF regime exists below MeADAF.
Current usage metrics show cumulative count of Article Views (full-text article views including HTML views, PDF and ePub downloads, according to the available data) and Abstracts Views on Vision4Press platform.
Data correspond to usage on the plateform after 2015. The current usage metrics is available 48-96 hours after online publication and is updated daily on week days.
Initial download of the metrics may take a while.