Fig. 9
Download original image
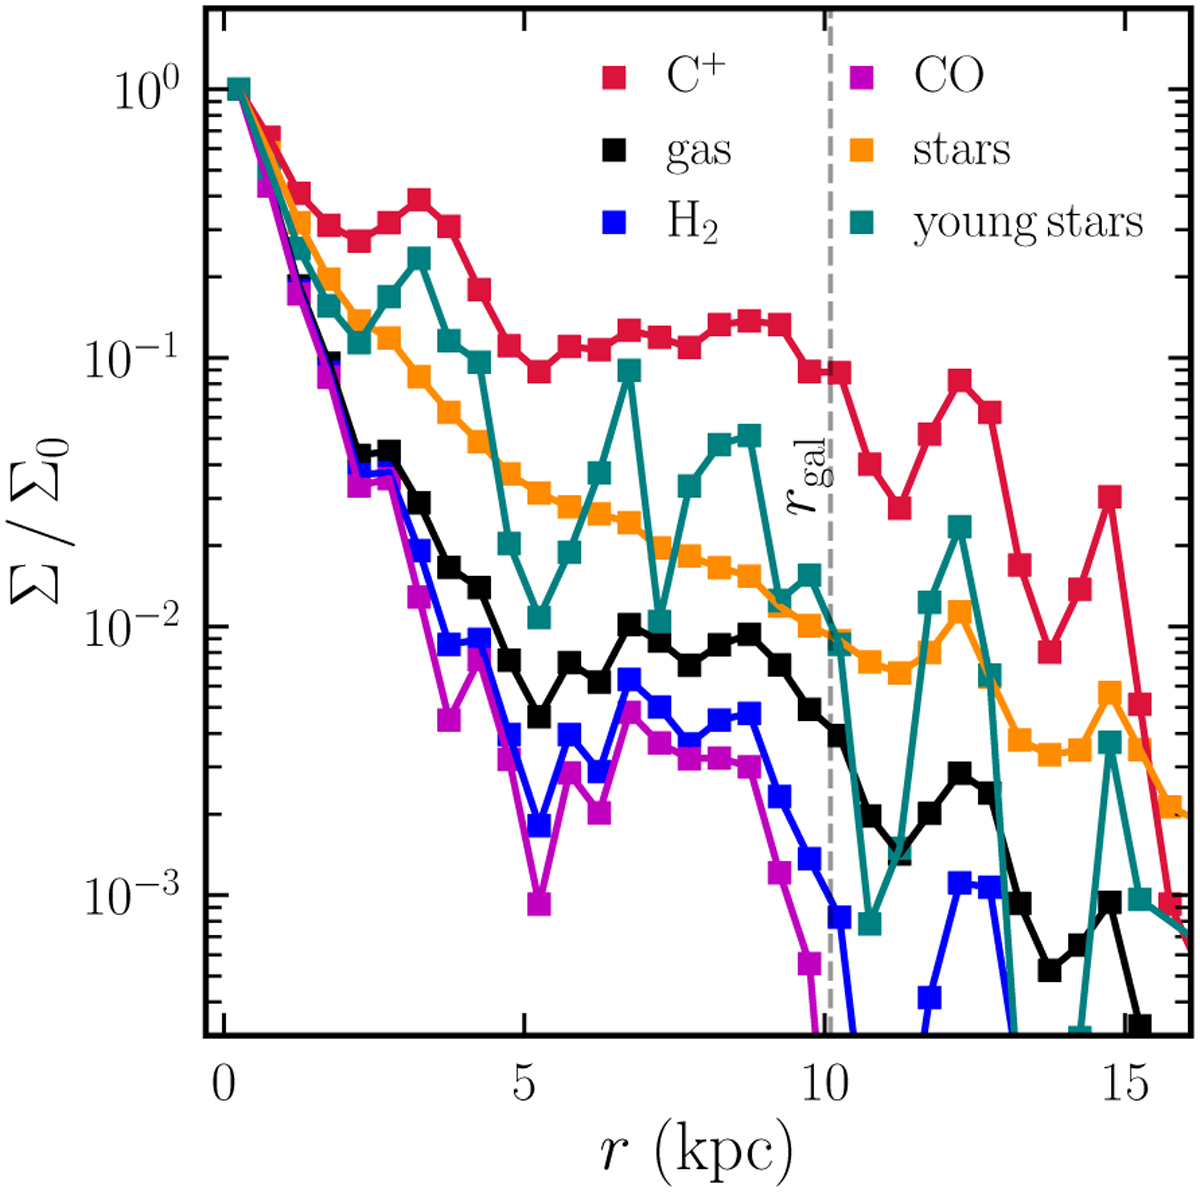
Surface density profiles of gas (black), H2 (blue), CO (magenta), C+ (red), stars (orange), and young stars (teal, with ages less than 10 Myr) within the HYACINTH-post-processed galaxy. For each component, the profiles are normalised by their central value σ0. For each radial bin, we calculate the surface density from the face-on projection from a cylinder with height of ±5 kpc. Among all components, C+ and young stars show the slowest decline as we move away from the centre of the galaxy, while H2 and CO are more concentrated (see also Fig. 5). The dashed grey line denotes the size of the galaxy as defined in T15.
Current usage metrics show cumulative count of Article Views (full-text article views including HTML views, PDF and ePub downloads, according to the available data) and Abstracts Views on Vision4Press platform.
Data correspond to usage on the plateform after 2015. The current usage metrics is available 48-96 hours after online publication and is updated daily on week days.
Initial download of the metrics may take a while.