Fig. 7
Download original image
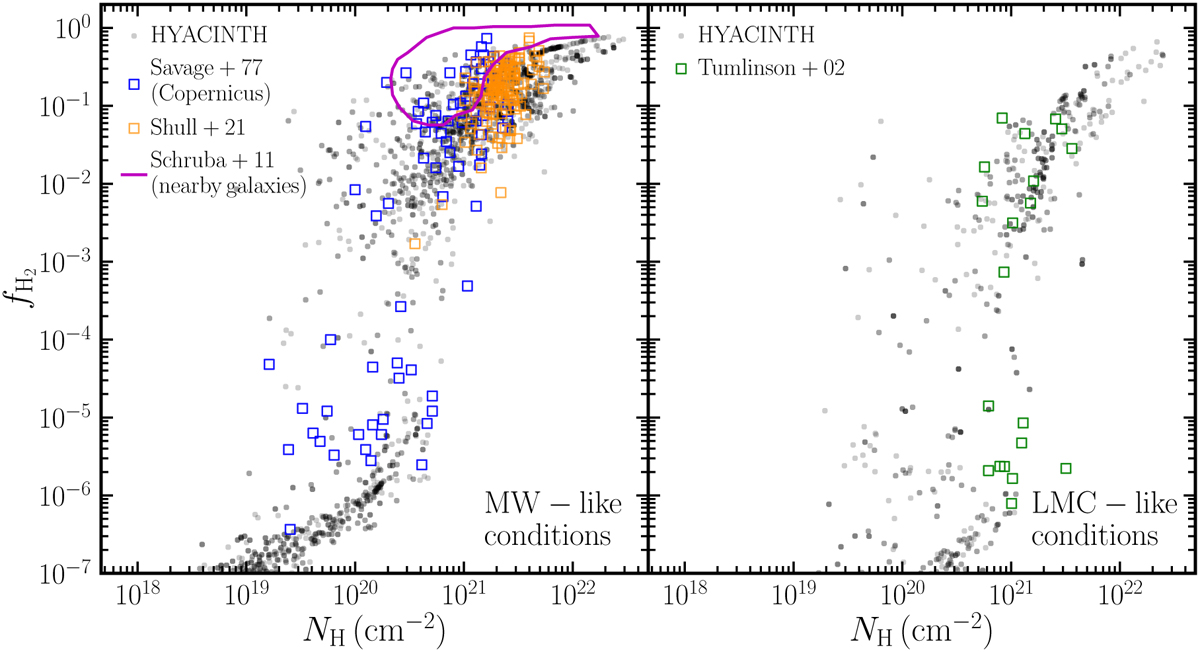
H2 fraction as a function of the total column density of hydrogen ![]() , where
, where ![]() . Left: the HYACΓNTH-post-processed regions with MW-like conditions are shown in black. The observed data are from Savage et al. (1977) (blue open squares), Shull et al. (2021) (orange open squares), Schruba et al. (2011) (magenta dots). For clarity, here we only show a contour enclosing all data points for Schruba et al. (2011). Right: the HYACINTH-post-processed regions with LMC-like conditions (black) compared to the observed data from Tumlinson et al. (2002) (green open squares). For HYACINTH data, we use a uniform ζH = ζH,MW and the column densities are calculated in a position-position-velocity cube of 156 pc 156 pc × 40 km s−1, where 156 pc is the spatial resolution of the AMR grid in the simulation at the redshift of post-processing and 40 km s−1 is an upper limit on the observed velocity dispersion in the various absorption measurements used in this comparison.
. Left: the HYACΓNTH-post-processed regions with MW-like conditions are shown in black. The observed data are from Savage et al. (1977) (blue open squares), Shull et al. (2021) (orange open squares), Schruba et al. (2011) (magenta dots). For clarity, here we only show a contour enclosing all data points for Schruba et al. (2011). Right: the HYACINTH-post-processed regions with LMC-like conditions (black) compared to the observed data from Tumlinson et al. (2002) (green open squares). For HYACINTH data, we use a uniform ζH = ζH,MW and the column densities are calculated in a position-position-velocity cube of 156 pc 156 pc × 40 km s−1, where 156 pc is the spatial resolution of the AMR grid in the simulation at the redshift of post-processing and 40 km s−1 is an upper limit on the observed velocity dispersion in the various absorption measurements used in this comparison.
Current usage metrics show cumulative count of Article Views (full-text article views including HTML views, PDF and ePub downloads, according to the available data) and Abstracts Views on Vision4Press platform.
Data correspond to usage on the plateform after 2015. The current usage metrics is available 48-96 hours after online publication and is updated daily on week days.
Initial download of the metrics may take a while.