Fig. 5
Download original image
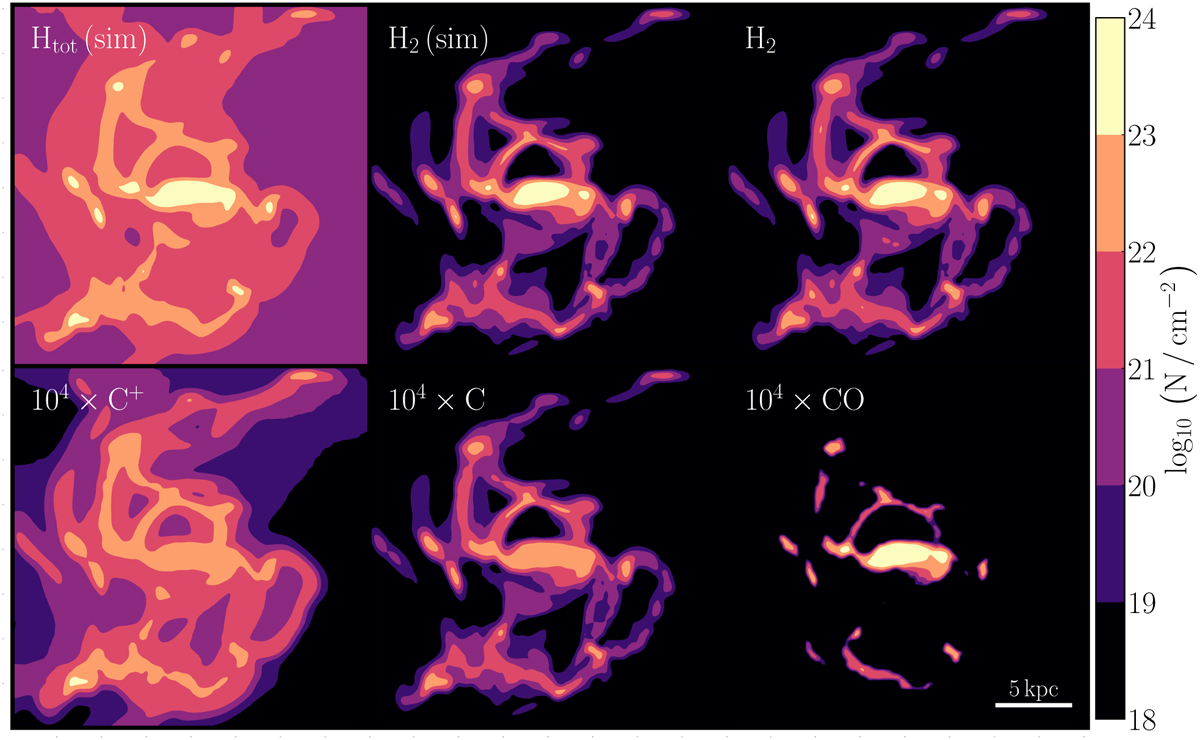
Column density maps of different species in the simulated galaxy after post-processing. The total hydrogen and H2 from the simulation are shown in the first two panels. The remaining panels show the column density of H2, C+ , C, and CO obtained via post-processing. The H2 from post-processing (top row, third panel) is remarkably similar to the H2 from the simulation (top row, second panel). CO dominates the carbon budget in the highest ![]() regions and is essentially absent when
regions and is essentially absent when ![]() cm−2. Atomic carbon traces the full extent of the H2 distribution, while C+ extends farther out to regions devoid of a significant amount of H2.
cm−2. Atomic carbon traces the full extent of the H2 distribution, while C+ extends farther out to regions devoid of a significant amount of H2.
Current usage metrics show cumulative count of Article Views (full-text article views including HTML views, PDF and ePub downloads, according to the available data) and Abstracts Views on Vision4Press platform.
Data correspond to usage on the plateform after 2015. The current usage metrics is available 48-96 hours after online publication and is updated daily on week days.
Initial download of the metrics may take a while.