Open Access
Fig. 4
Download original image
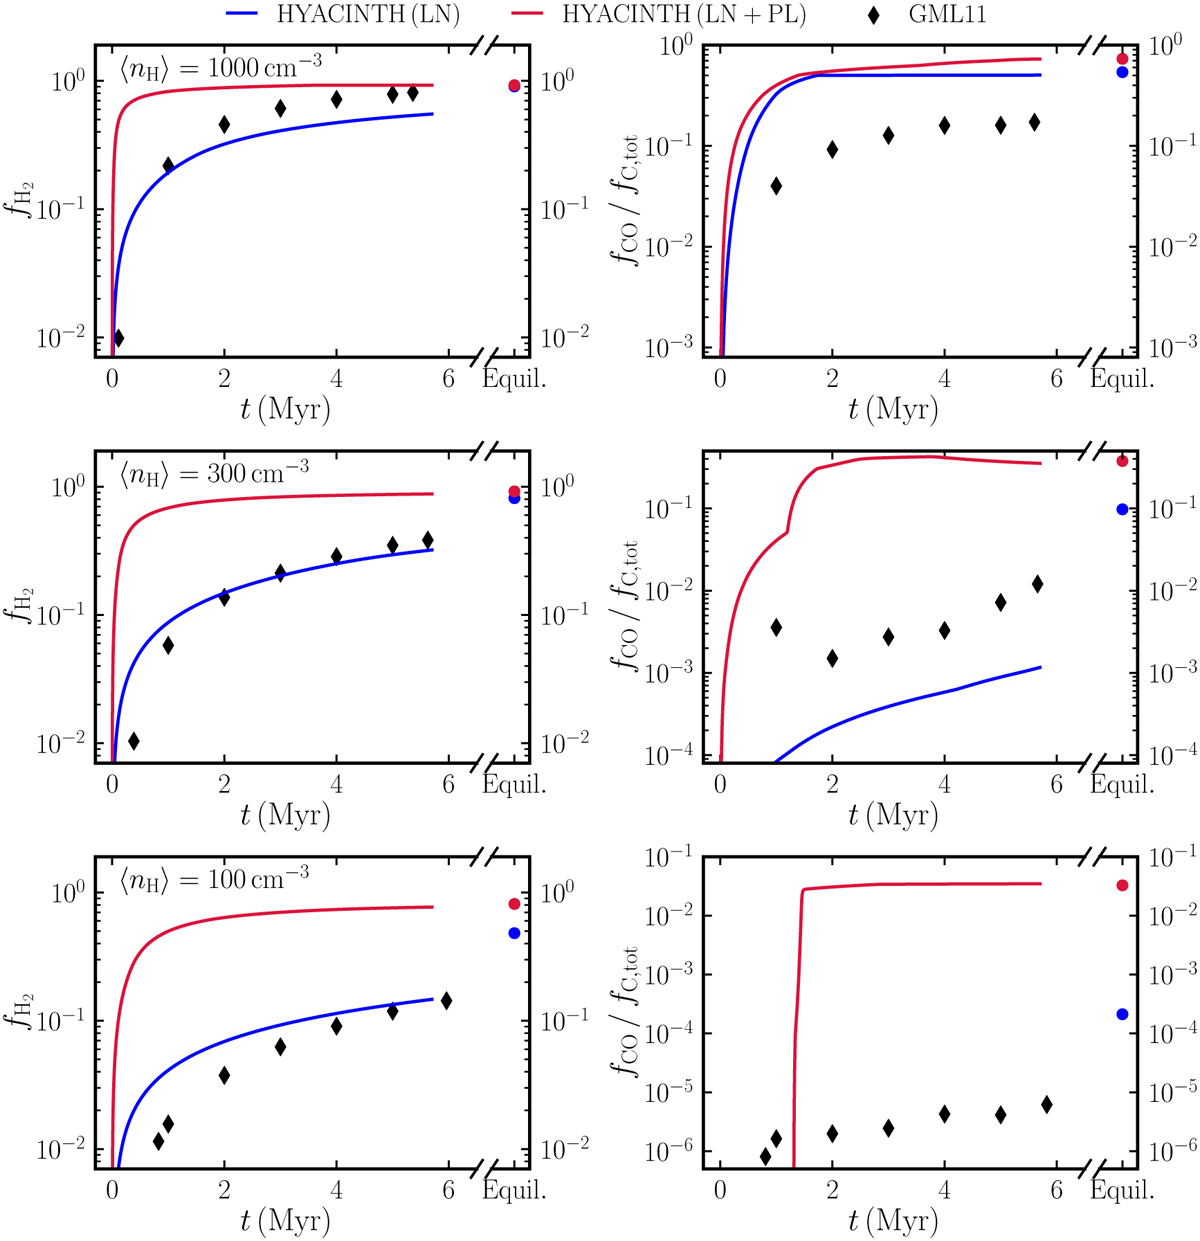
Comparison of the chemical abundances from HYACINTH against those from the Z = 0.1 Z⊙ runs from GML11 as a function of time. For 〈nH〉 = 100 cm−3, very little CO is formed when using the LN PDF (not visible in the bottom-right panel). The circles on the right-hand side denote the equilibrium abundances.
Current usage metrics show cumulative count of Article Views (full-text article views including HTML views, PDF and ePub downloads, according to the available data) and Abstracts Views on Vision4Press platform.
Data correspond to usage on the plateform after 2015. The current usage metrics is available 48-96 hours after online publication and is updated daily on week days.
Initial download of the metrics may take a while.