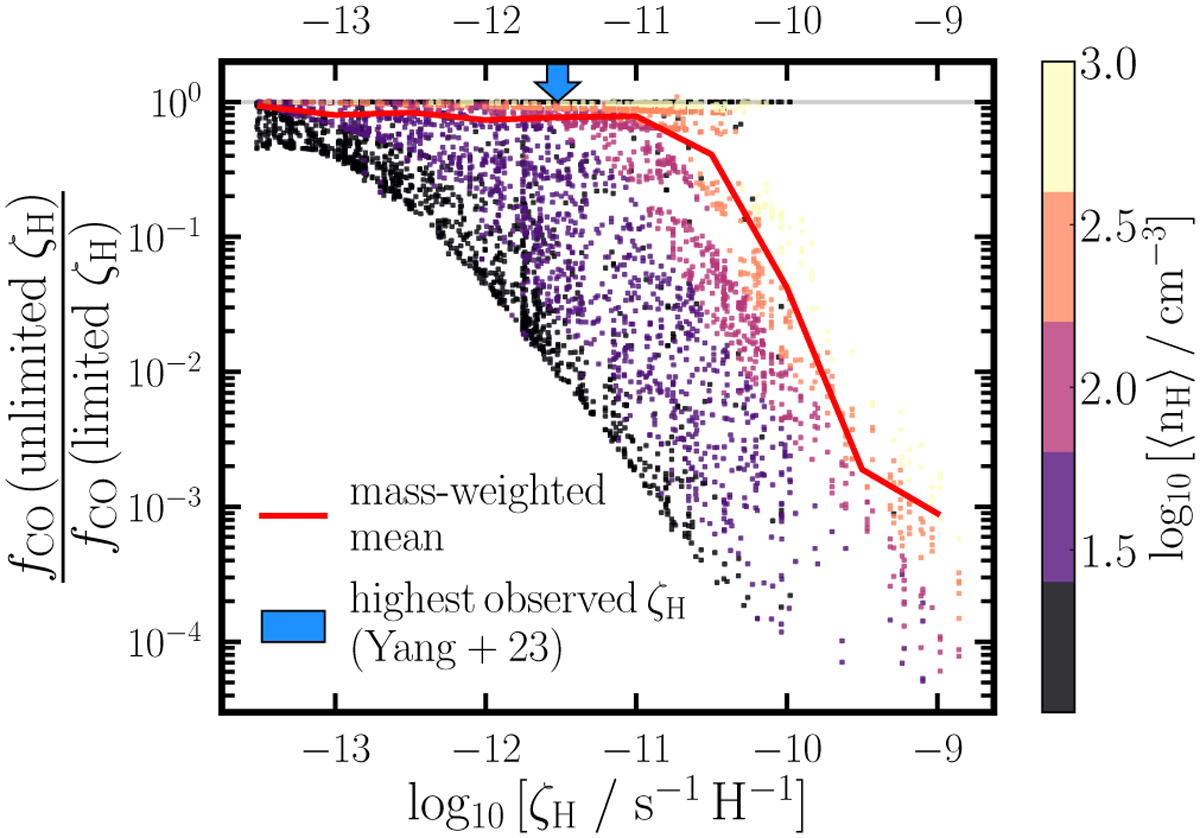
Fig. D.1

Download original image
Ratio of the ƒCO obtained when using a ζH ∝χ2 without and with an upper limit on ζH, as a function of ζH in the post-processed galaxy. Here we only show the grid cells with ζH greater than the imposed upper limit of 3 × 10⁻¹⁴ s−1 H−1, since the two ƒCO are identical for lower CRIR values. Each grid cell is colour-coded by the mean hydrogen density 〈nH〉 in the cell. The red line shows the mass-weighted mean of the cells in each ζH bin. We also indicate by a blue arrow the highest observed ζH of 3 × 10⁻¹² s−1 H−1 (from Yang etal. 2023).
Current usage metrics show cumulative count of Article Views (full-text article views including HTML views, PDF and ePub downloads, according to the available data) and Abstracts Views on Vision4Press platform.
Data correspond to usage on the plateform after 2015. The current usage metrics is available 48-96 hours after online publication and is updated daily on week days.
Initial download of the metrics may take a while.


