Fig. 1
Download original image
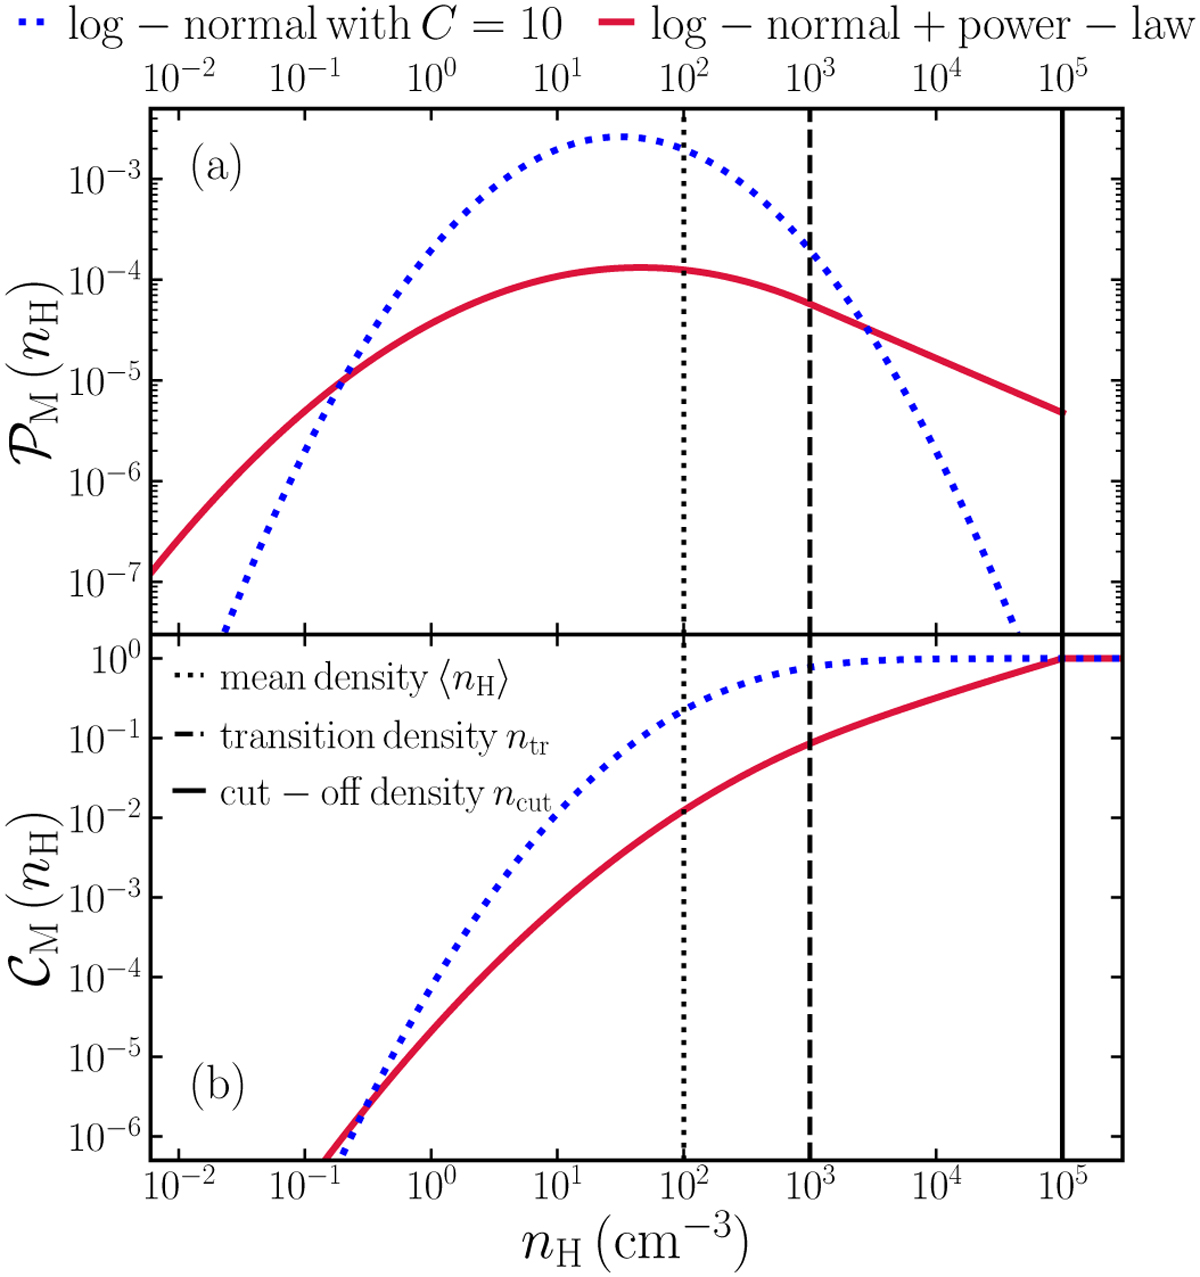
Probability distribution functions (PDFs) and the corresponding cumulative distribution functions (CDFs) used in this study. Panel a shows the mass-weighted PDFs in sample simulation cells as a function of the sub-grid density nH, where PM(nH) dnH denotes the fraction of the total cell mass present at sub-grid densities in the range [nH, nH + dnH]. The log-normal (Eq. (1)) and the log-normal+power-law (Eq. (3)) PDFs are shown in blue and red, respectively. The sample cells have a mean hydrogen density 〈nH〉 = 100 cm-3 (shown by the dotted black line). For the log-normal+power-law PDF, the transition density ntr and the cut-off density ncut are shown by the dashed and solid black lines, respectively. Panel b shows the corresponding CDFs, that is, CM (nH) denotes the fraction of the total cell mass present at sub-grid densities below nH . For the log-normal+power-law PDF shown here, the power-law tail encloses ~91% of the total cell mass.
Current usage metrics show cumulative count of Article Views (full-text article views including HTML views, PDF and ePub downloads, according to the available data) and Abstracts Views on Vision4Press platform.
Data correspond to usage on the plateform after 2015. The current usage metrics is available 48-96 hours after online publication and is updated daily on week days.
Initial download of the metrics may take a while.