Fig. 7
Download original image
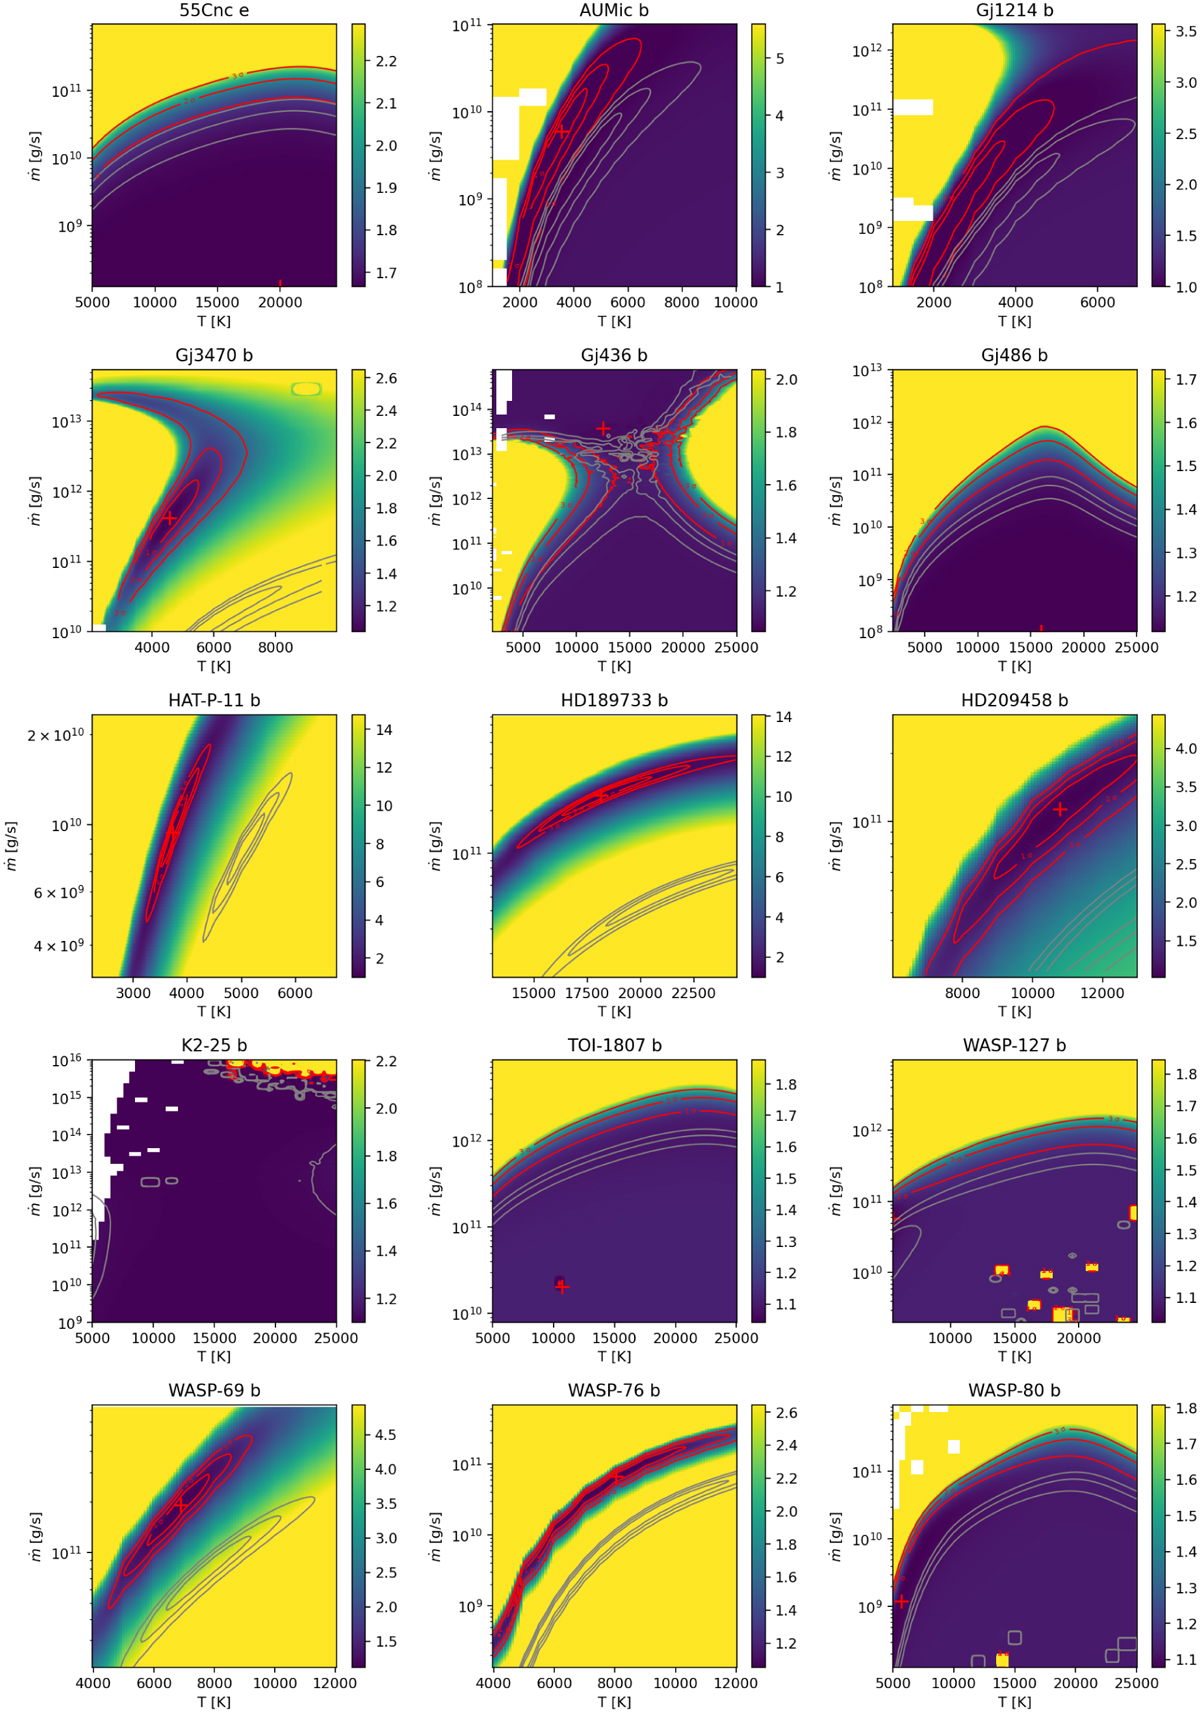
Reduced χ2 maps obtained for each target with the model parameters from Table 5. The vertical axis shows the mass-loss rate (![]() ) in log-scale, and the horizontal axis shows the temperature in linear scale. Higher χ2 values are shown in yellow and lower values are in blue. Parts of the grids contain NaN values (white areas) where the model failed to converge to a physical solution. The minimum χ2 value position is shown with a red cross, encircled by 1, 2, and 3σ contours in red and corresponding to our main model with a high H/He ratio (≥98/2, corresponding to model M1 in Sec. 5.1). The confidence intervals overplotted in gray show the best fits obtained with the same model but using a solar H/He ratio (90/10, corresponding to model M4 in Sect. 5.1) for comparison. Our estimation of the error that we used for the reduced χ2 computation is detailed in Appendix F.3. We note the apparent correlation between
) in log-scale, and the horizontal axis shows the temperature in linear scale. Higher χ2 values are shown in yellow and lower values are in blue. Parts of the grids contain NaN values (white areas) where the model failed to converge to a physical solution. The minimum χ2 value position is shown with a red cross, encircled by 1, 2, and 3σ contours in red and corresponding to our main model with a high H/He ratio (≥98/2, corresponding to model M1 in Sec. 5.1). The confidence intervals overplotted in gray show the best fits obtained with the same model but using a solar H/He ratio (90/10, corresponding to model M4 in Sect. 5.1) for comparison. Our estimation of the error that we used for the reduced χ2 computation is detailed in Appendix F.3. We note the apparent correlation between ![]() and T in the case of detections and tentative detections, which is further detailed in Sec. 6.1.
and T in the case of detections and tentative detections, which is further detailed in Sec. 6.1.
Current usage metrics show cumulative count of Article Views (full-text article views including HTML views, PDF and ePub downloads, according to the available data) and Abstracts Views on Vision4Press platform.
Data correspond to usage on the plateform after 2015. The current usage metrics is available 48-96 hours after online publication and is updated daily on week days.
Initial download of the metrics may take a while.