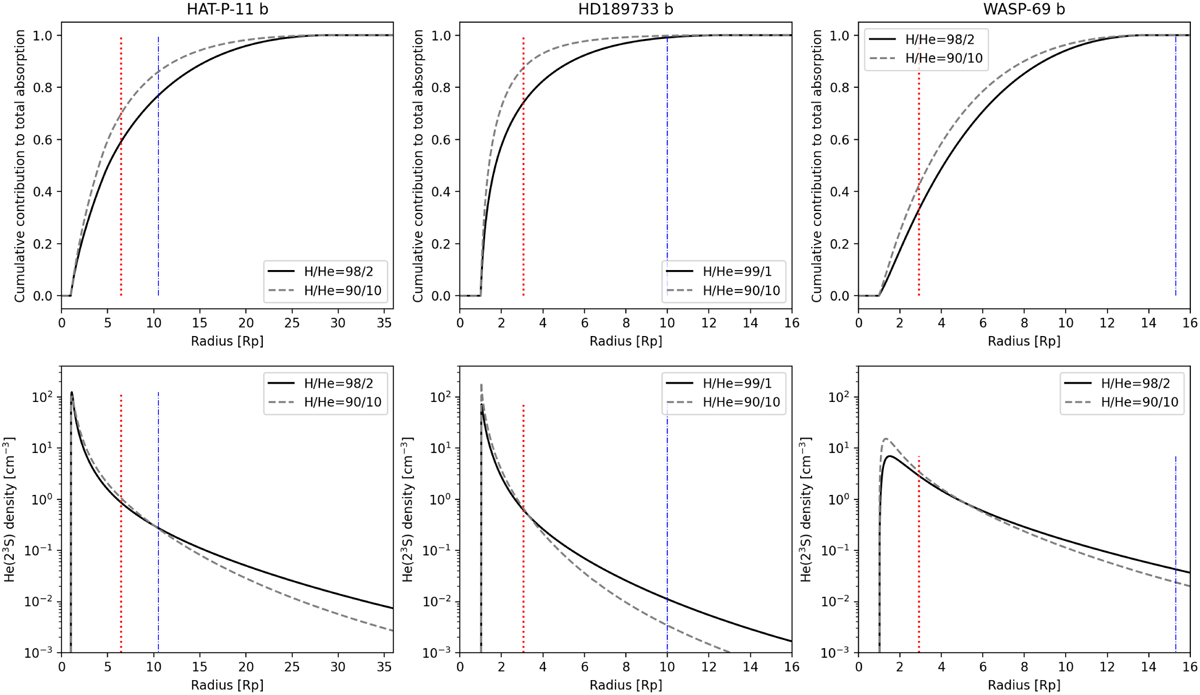
Fig. 6
Download original image
Structure of the escape for the three detections. Upper panel: cumulative contribution of each altitude grid layer to the total absorption in the best model. Lower panel: metastable helium density profile corresponding to the best model. In both panels, the solid black curve corresponds to the best parameters found for model “M1” (H/He ≥ 98/2) and the gray dashed line corresponds to the best solution for model “M4” (H/He = 90/10). The dotted vertical red line indicates the Roche lobe radius and the dash-dotted vertical blue lines correspond to our calculation of the ionopause standoff distance (Khodachenko et al. 2019).
Current usage metrics show cumulative count of Article Views (full-text article views including HTML views, PDF and ePub downloads, according to the available data) and Abstracts Views on Vision4Press platform.
Data correspond to usage on the plateform after 2015. The current usage metrics is available 48-96 hours after online publication and is updated daily on week days.
Initial download of the metrics may take a while.