Fig. 5
Download original image
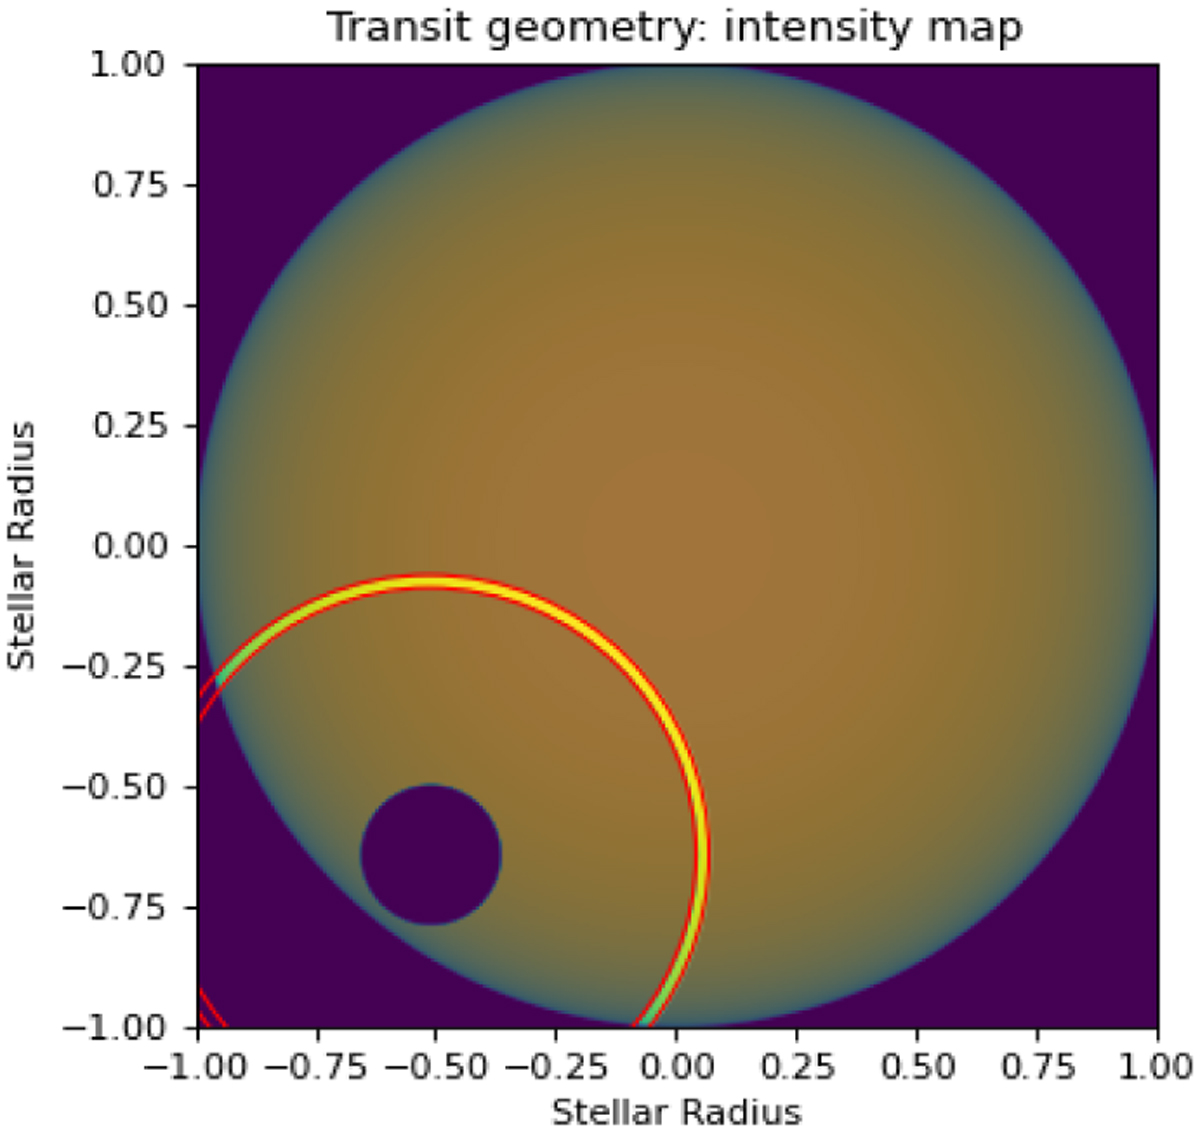
Example of an intensity grid computed for HD 189733 b and used in the transit geometry module. The stellar intensity is computed over a grid, the number of cells in the grid being set such that the thinnest planetary atmospheric layer covers at least two pixels. The map corresponds to a given transit phase, the cells covered by the planetary solid disk at 1 Rp being masked out. One of the altitude layers is represented here, limited by the two red rings. The contribution of each altitude layer is computed using the intensity map to take into account the intersection (highlighted pixels) of each altitude layer with the stellar intensity surface.
Current usage metrics show cumulative count of Article Views (full-text article views including HTML views, PDF and ePub downloads, according to the available data) and Abstracts Views on Vision4Press platform.
Data correspond to usage on the plateform after 2015. The current usage metrics is available 48-96 hours after online publication and is updated daily on week days.
Initial download of the metrics may take a while.