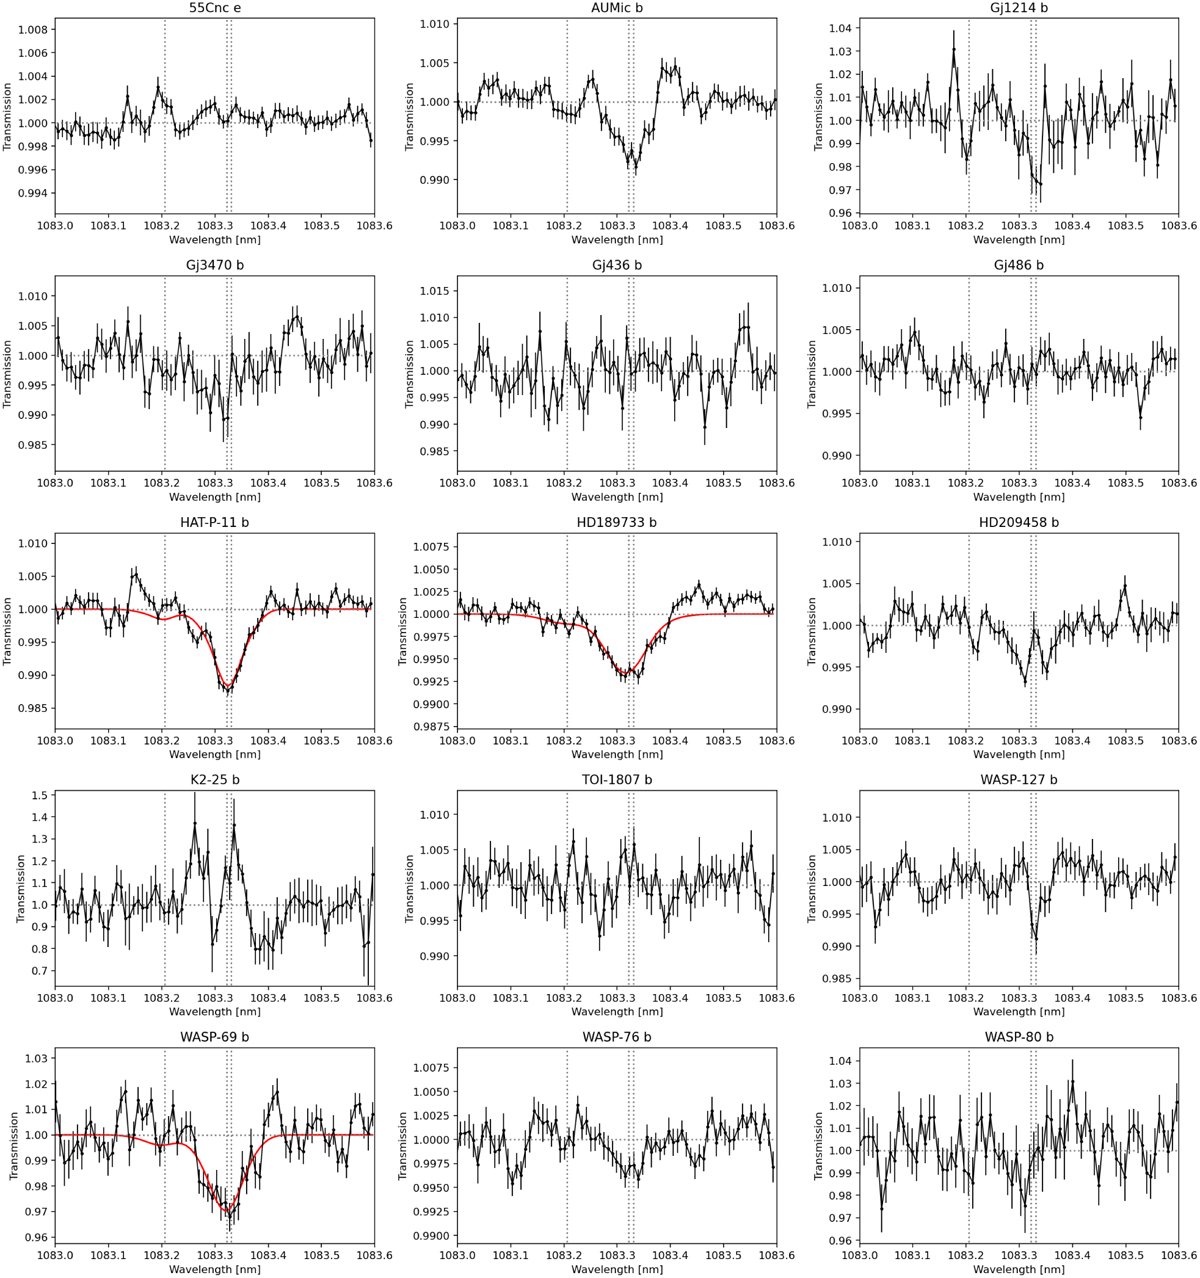
Fig. 4
Download original image
Final averaged spectra for each target. If several transits were available for a given target, the final spectrum was obtained by averaging the spectra together, weighting each spectrum by the inverse square of its estimated error. The vertical dotted gray lines show the theoretical position of the He triplet lines, and the horizontal dotted gray line represents the null model (no absorption). The best fit (corresponding to our main model M1, see Sec. 5.1) is shown in red for the three detections. Wavelengths are given in vacuum. Error bars are given for a 95% confidence interval. The calculation of the error bars is detailed in Appendix F.1.
Current usage metrics show cumulative count of Article Views (full-text article views including HTML views, PDF and ePub downloads, according to the available data) and Abstracts Views on Vision4Press platform.
Data correspond to usage on the plateform after 2015. The current usage metrics is available 48-96 hours after online publication and is updated daily on week days.
Initial download of the metrics may take a while.