Fig. 3
Download original image
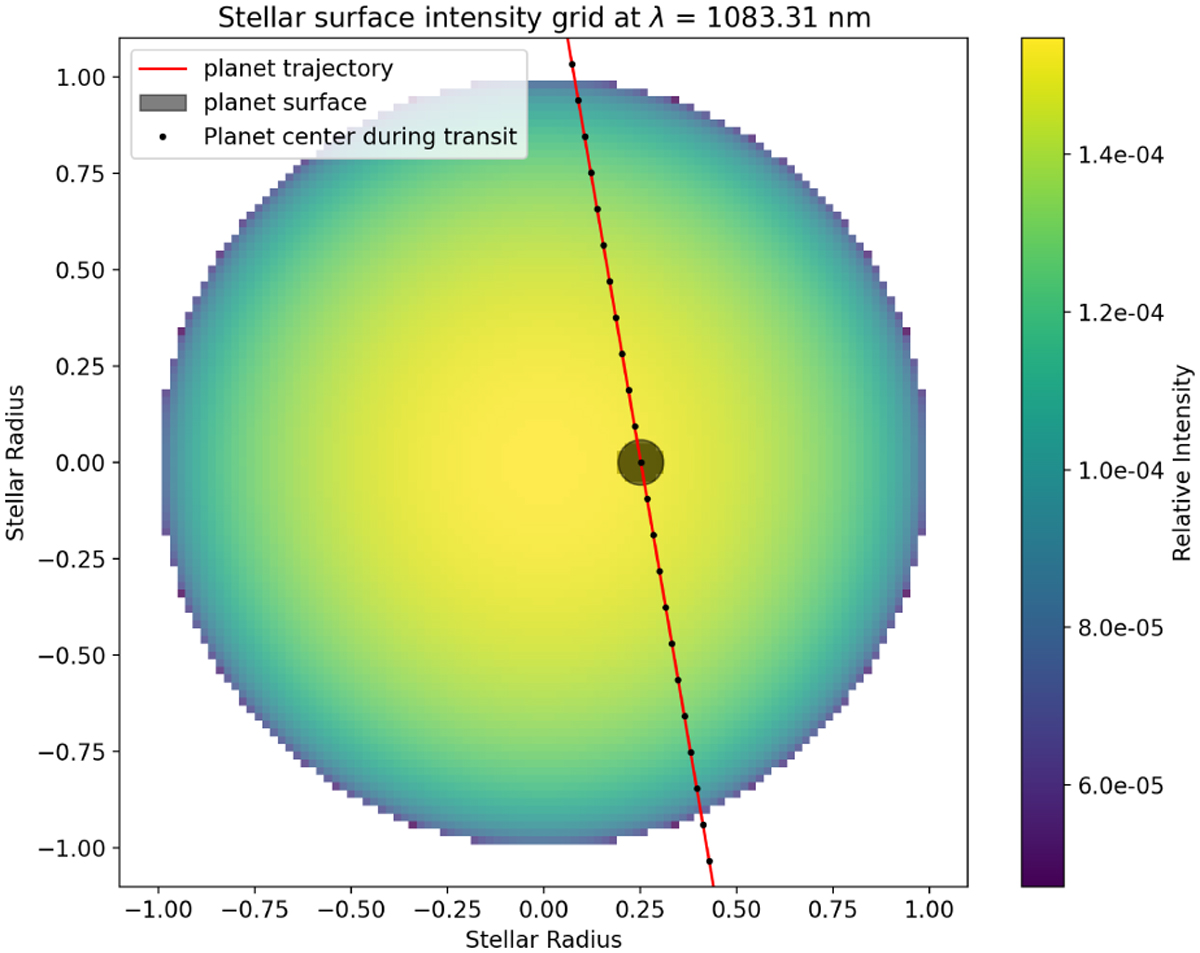
Stellar surface intensity map at 1083.31 nm computed with PYSME in the case of HAT-P-11 b. The intensity map is relative to the integrated intensity over the stellar map at 1083.31 nm. The grid contains 101 × 101 cells, and the planet’s trajectory is shown with a red solid line with black dots indicating the planet’s center at each observed phase. The planet solid disk is shown at a given phase, with the underlying stellar cells being excluded from the master spectrum computation.
Current usage metrics show cumulative count of Article Views (full-text article views including HTML views, PDF and ePub downloads, according to the available data) and Abstracts Views on Vision4Press platform.
Data correspond to usage on the plateform after 2015. The current usage metrics is available 48-96 hours after online publication and is updated daily on week days.
Initial download of the metrics may take a while.