Fig. D.1
Download original image
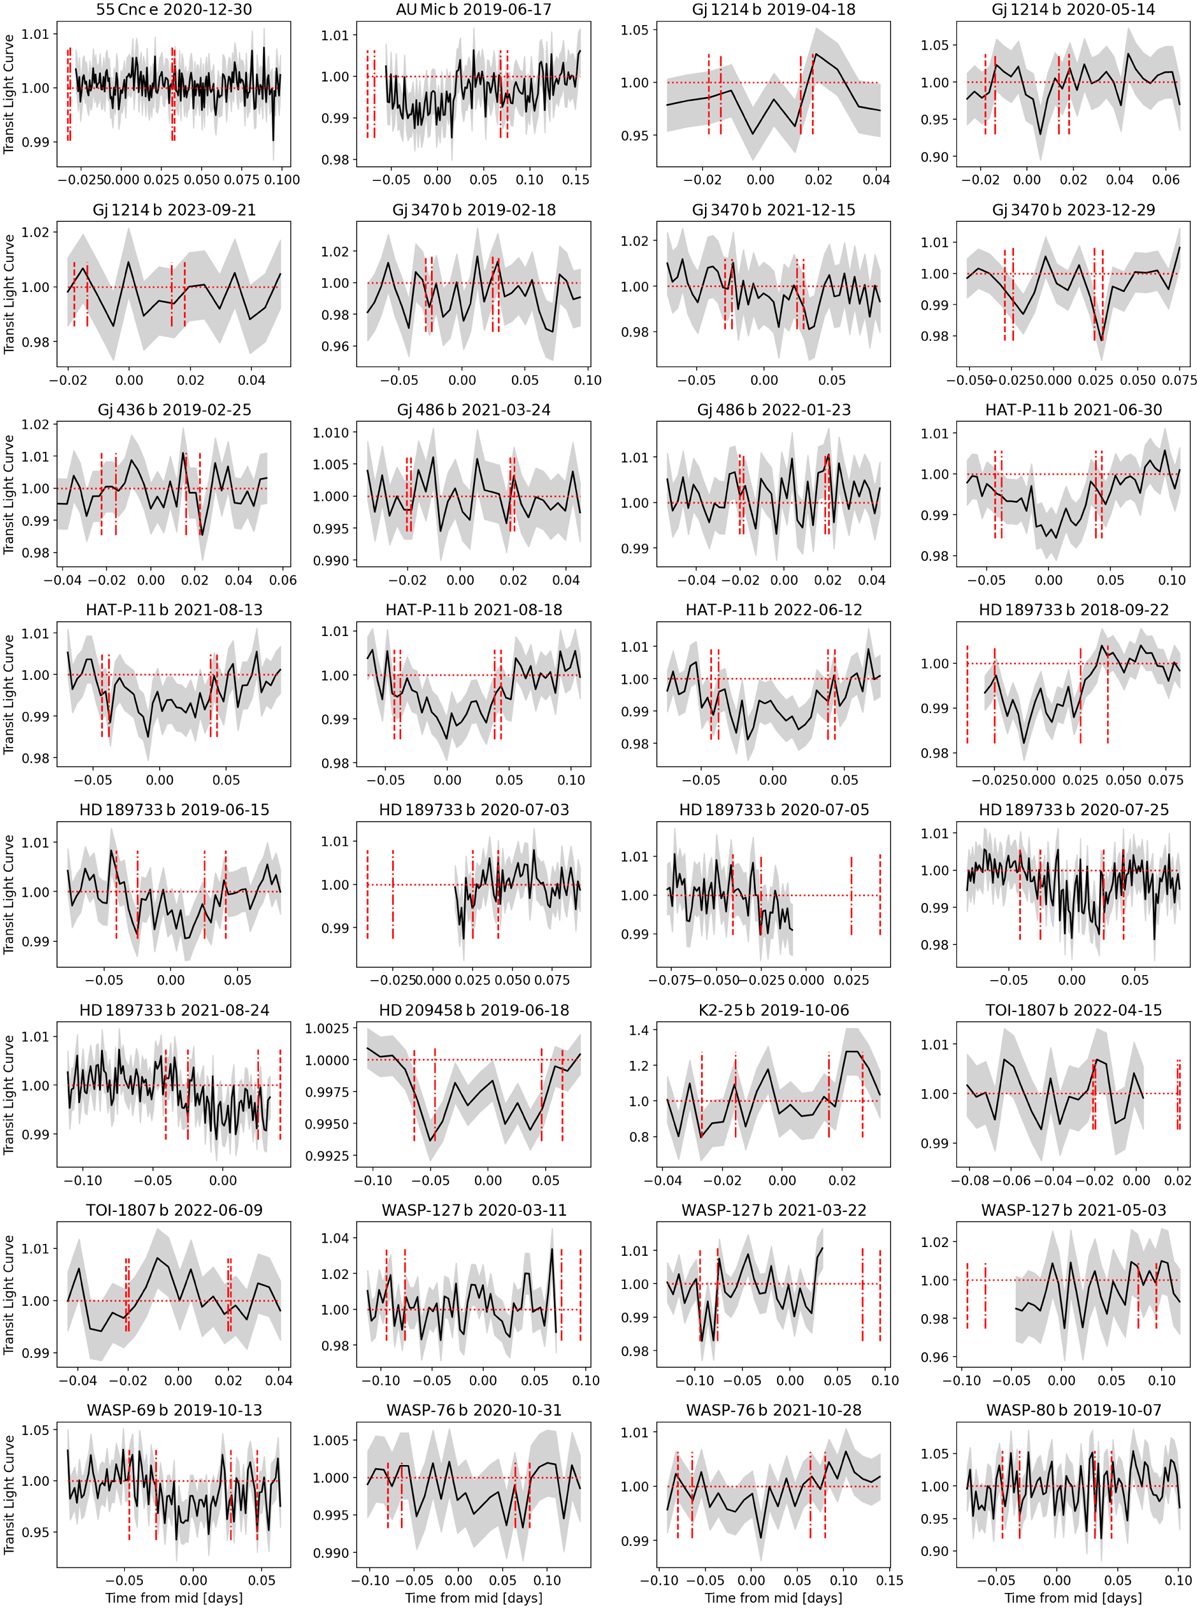
Light curve of each transit, computed by integrating the intensity of each spectrum in a spectral bin centered at the He triplet position for each observation. The horizontal axis shows the time from mid-transit in days, with the vertical dashed red lines showing contact points T1 (start of transit) and T4 (end of transit), and the dash-dotted red ones showing the contact points T2 (end of ingress) and T3 (beginning of egress). Error bars are shown in light gray and correspond to a 95% confidence interval.
Current usage metrics show cumulative count of Article Views (full-text article views including HTML views, PDF and ePub downloads, according to the available data) and Abstracts Views on Vision4Press platform.
Data correspond to usage on the plateform after 2015. The current usage metrics is available 48-96 hours after online publication and is updated daily on week days.
Initial download of the metrics may take a while.