Fig. C.1
Download original image
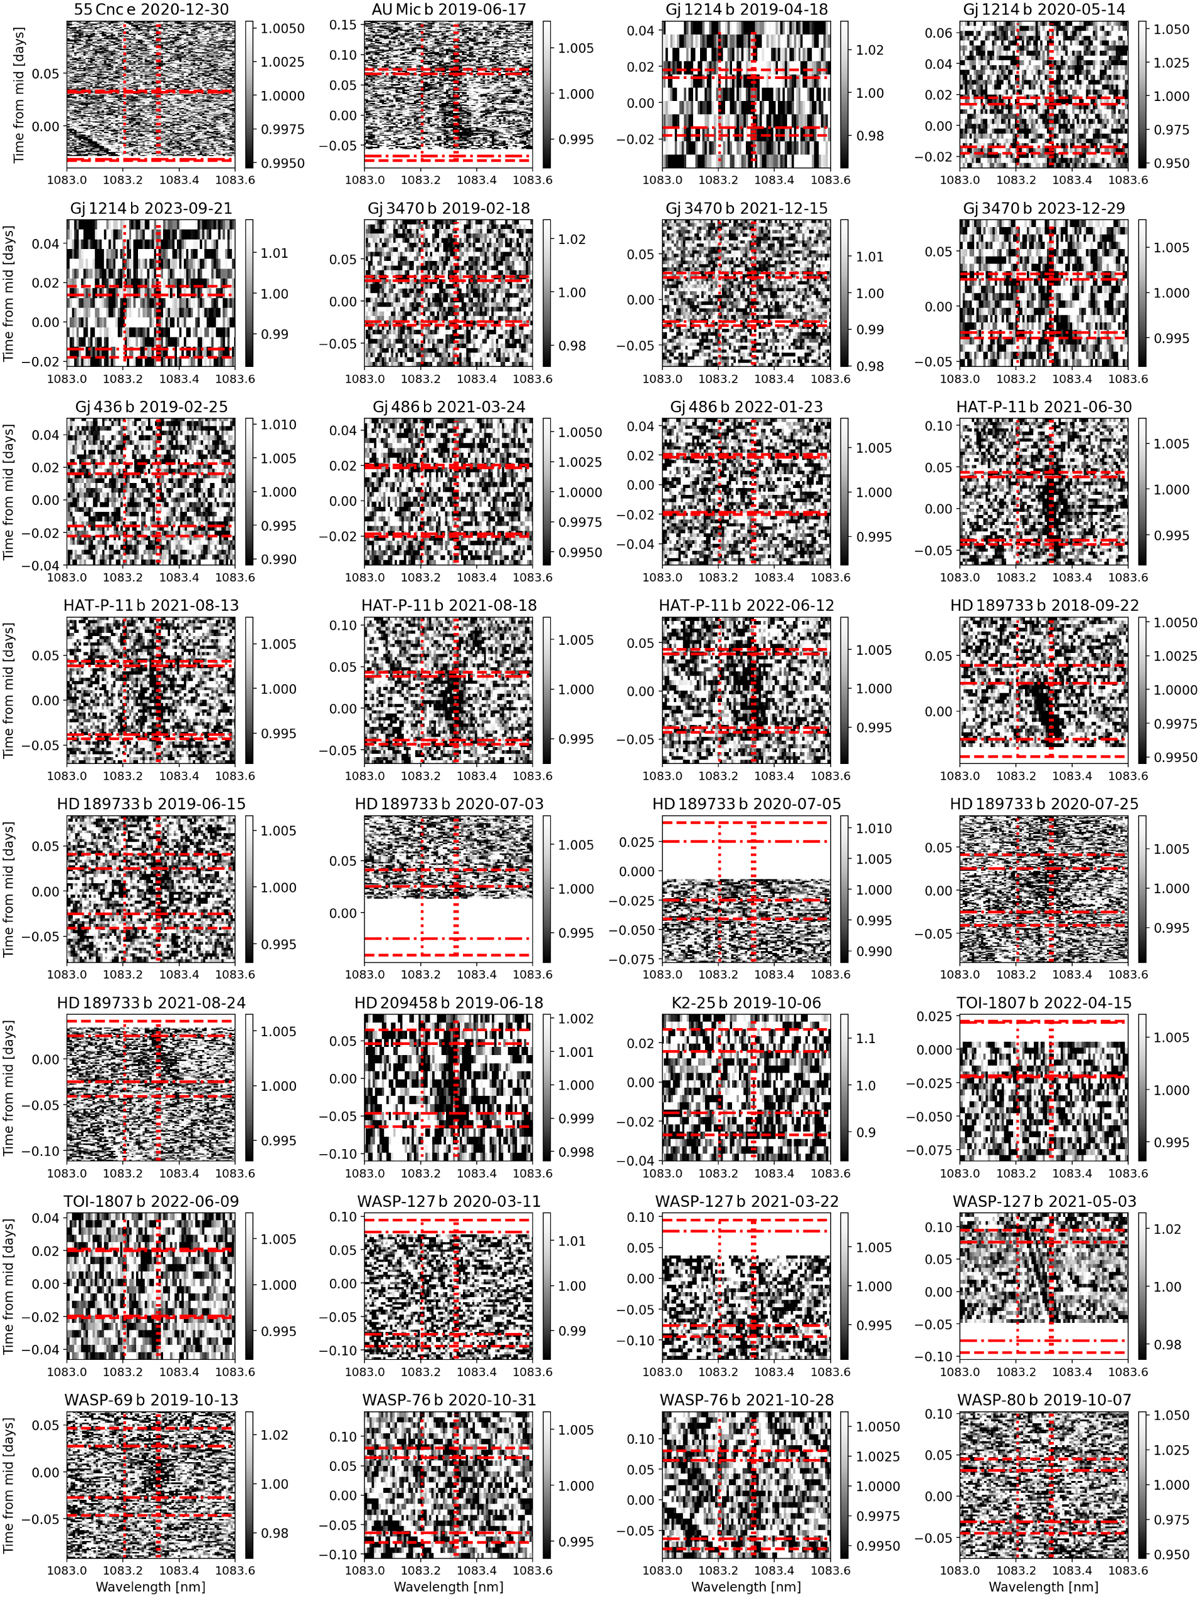
Time series of the data after reduction: axes are wavelengths in nm and time from mid-transit in days, with the grayscale mapping the normalized intensity. The gray scale span is set to ± 3 times the standard deviation of the data. The four contact points are indicated in horizontal red lines, the dashed ones corresponding to T1 and T4, and the dash-dotted ones to T2 and T3. Vertical dotted red lines indicate the theoretical position of the He triplet. An excess of absorption, attributed to planetary He, is visible during the transits of HAT-P-11 b, HD 189733 b, and WASP-69 b.
Current usage metrics show cumulative count of Article Views (full-text article views including HTML views, PDF and ePub downloads, according to the available data) and Abstracts Views on Vision4Press platform.
Data correspond to usage on the plateform after 2015. The current usage metrics is available 48-96 hours after online publication and is updated daily on week days.
Initial download of the metrics may take a while.