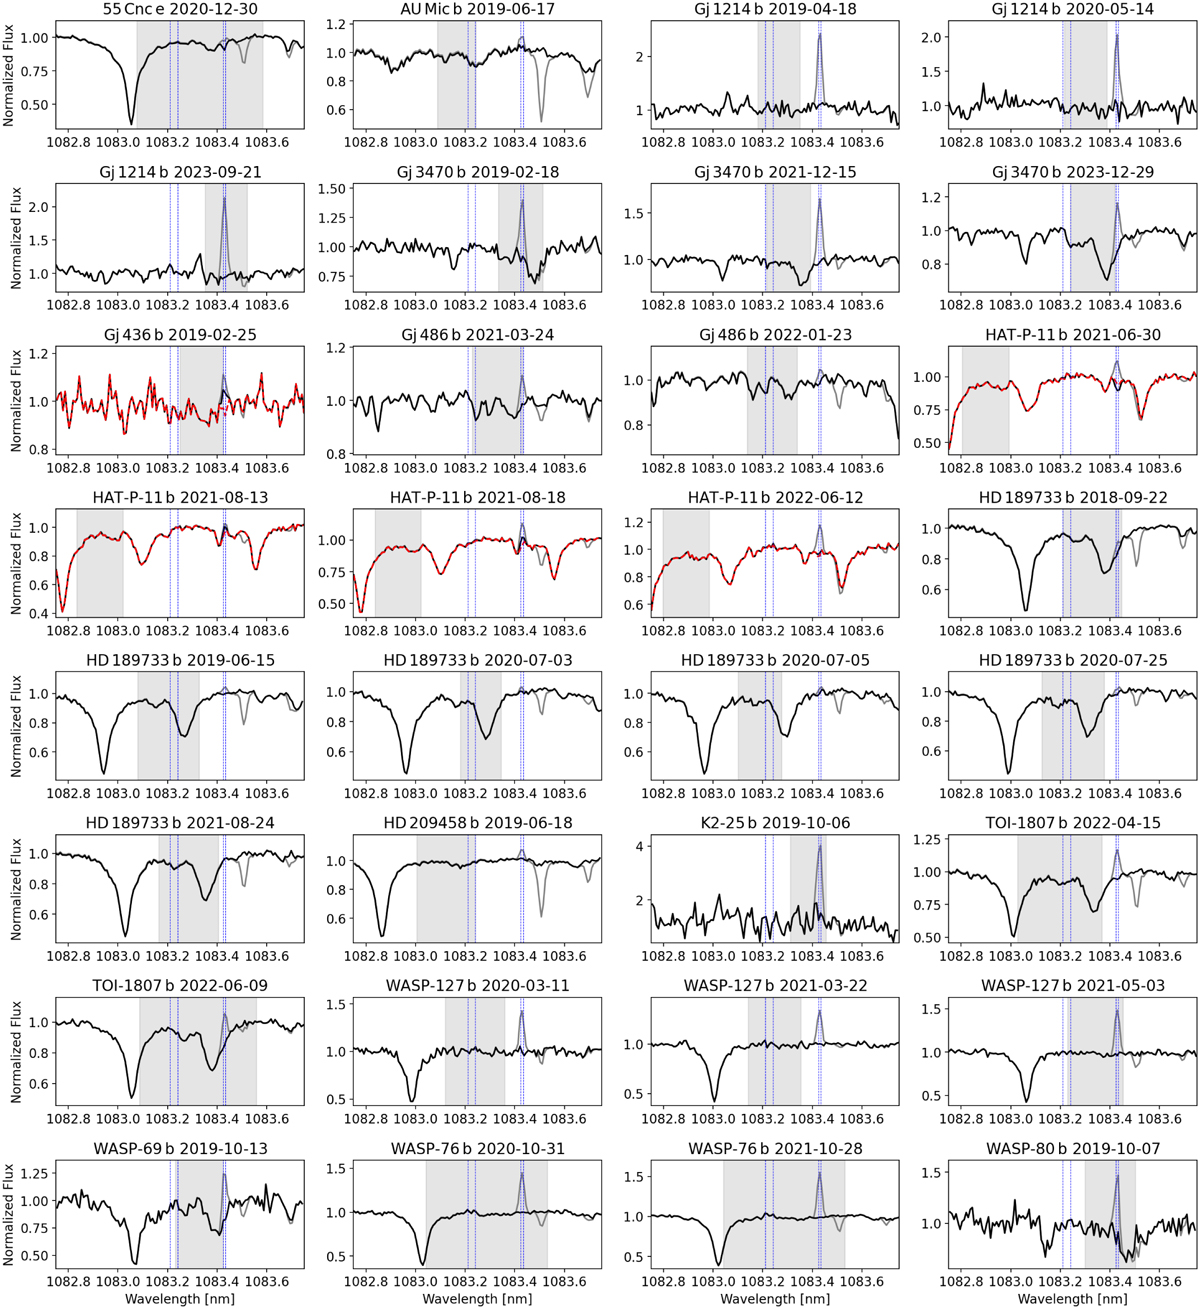
Fig. B.1
Download original image
Data from the E2DS “e” files before (solid gray) and after correction of the telluric lines by APERO (“t” files, solid black), using for each transit an arbitrary observation in the Earth rest frame as an example. The dotted blue vertical lines indicate the position of the OH emission lines, while the gray areas indicate the range of theoretical positions spanned by the planetary helium triplet lines in the Earth rest frame during the transit. For the transits of HAT-P-11 b and GJ 436 b we used our custom correction (dotted red line) of the OH emission lines as residuals of these lines were still visible in the “t” files even after APERO correction.
Current usage metrics show cumulative count of Article Views (full-text article views including HTML views, PDF and ePub downloads, according to the available data) and Abstracts Views on Vision4Press platform.
Data correspond to usage on the plateform after 2015. The current usage metrics is available 48-96 hours after online publication and is updated daily on week days.
Initial download of the metrics may take a while.