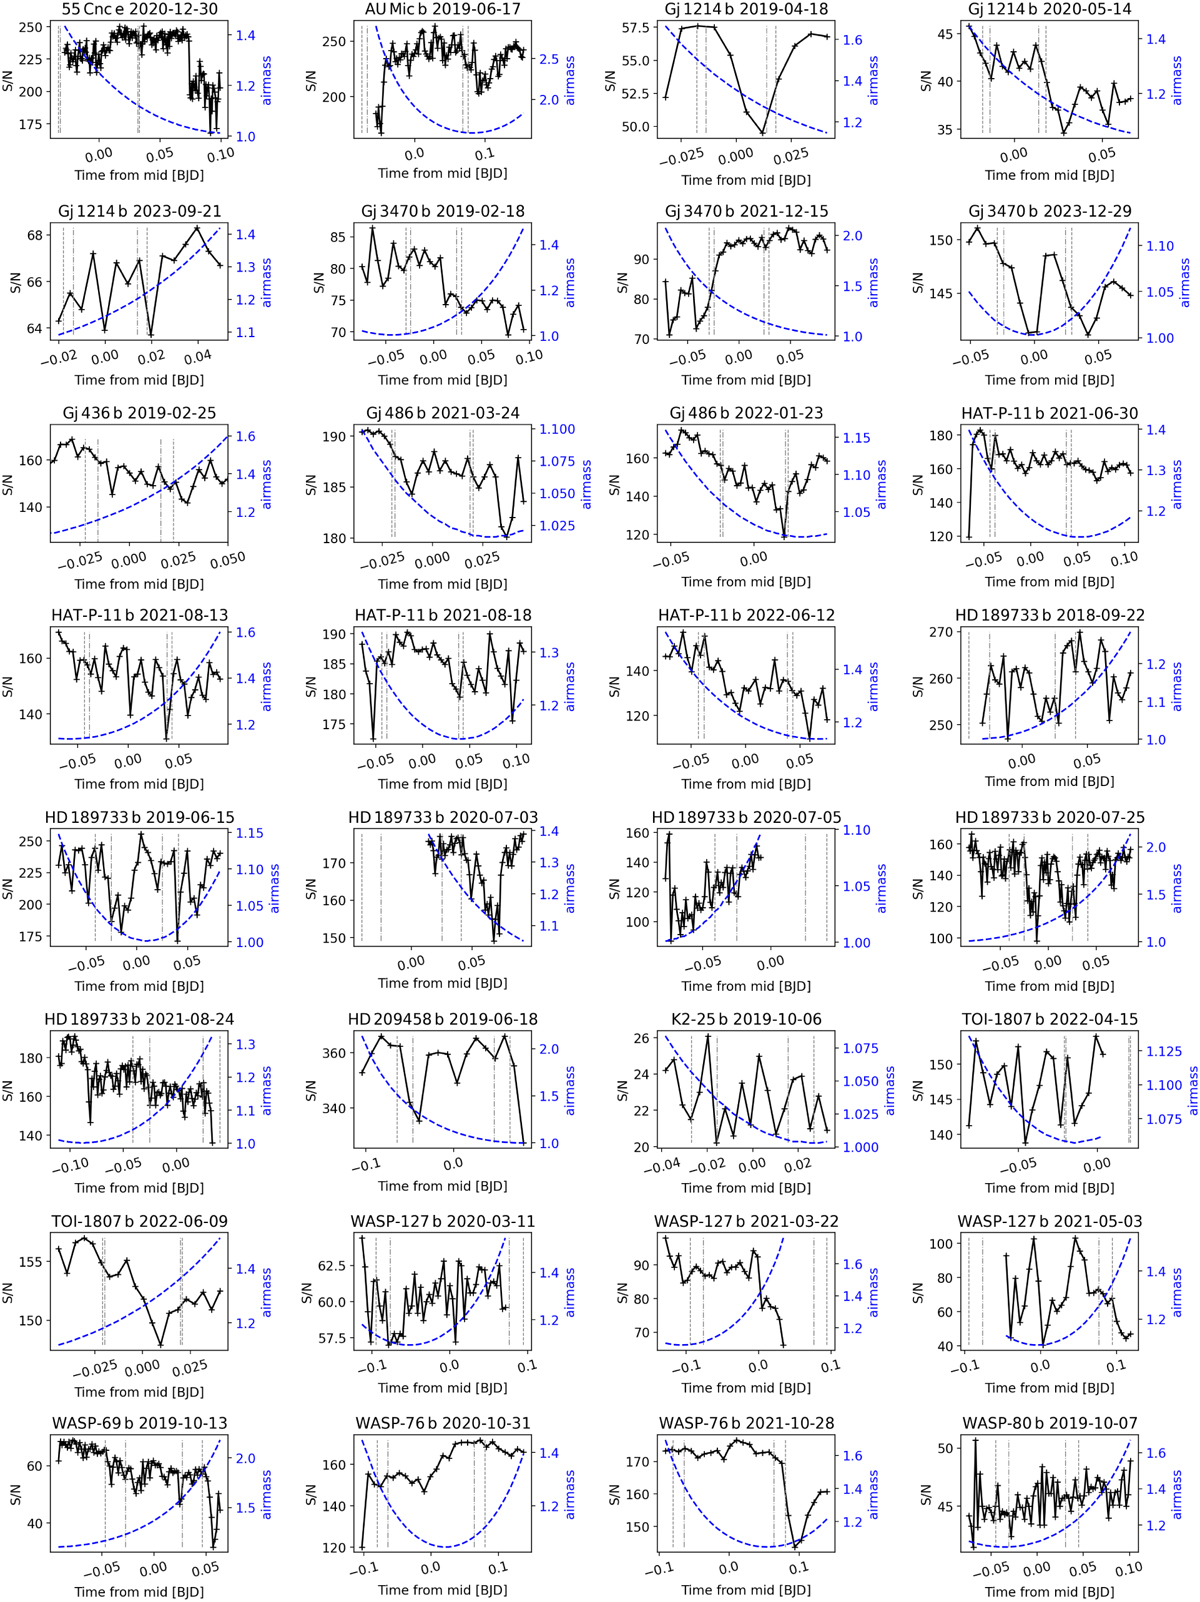
Fig. A.1
Download original image
Observation conditions for each studied transit: signal-to-noise ratio (S/N) evolution with respect to time from mid-transit is shown in the solid black curve. The S/N provided by SPIRou is measured in the H band (1.65 μm). The blue dashed curve shows the airmass evolution along time from mid-transit. The vertical gray lines indicate the four contact points: the dashed ones correspond to T1 (start of transit) and T4 (end of transit), and the dash-dotted ones to T2 (end of ingress) and T3 (beginning of egress).
Current usage metrics show cumulative count of Article Views (full-text article views including HTML views, PDF and ePub downloads, according to the available data) and Abstracts Views on Vision4Press platform.
Data correspond to usage on the plateform after 2015. The current usage metrics is available 48-96 hours after online publication and is updated daily on week days.
Initial download of the metrics may take a while.