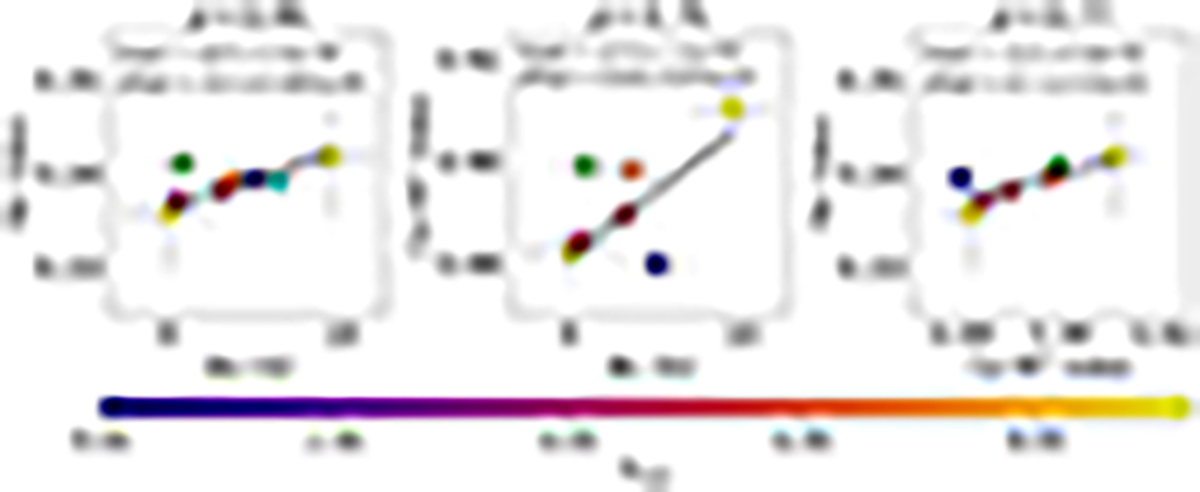
Fig. 4.
Download original image
Correlation plots for the activity proxies computed from the six Neo-Narval observations. From the left: Hα vs. |Bl|, Ca II IRT vs. |Bl|, and Hα vs. Ca II IRT. Each data point is colour-coded based on the rotational cycle as computed from Eq. (1). Each panel displays the Pearson correlation coefficient (ρ) at the top and a linear fit as black dashed line. The green cross indicates the values of the ESPaDOnS snapshot observation, but it was not included in the computation of the Pearson correlation coefficient. We included the first HARPSpol observation in the first panel as a blue cross.
Current usage metrics show cumulative count of Article Views (full-text article views including HTML views, PDF and ePub downloads, according to the available data) and Abstracts Views on Vision4Press platform.
Data correspond to usage on the plateform after 2015. The current usage metrics is available 48-96 hours after online publication and is updated daily on week days.
Initial download of the metrics may take a while.