Fig. 14
Download original image
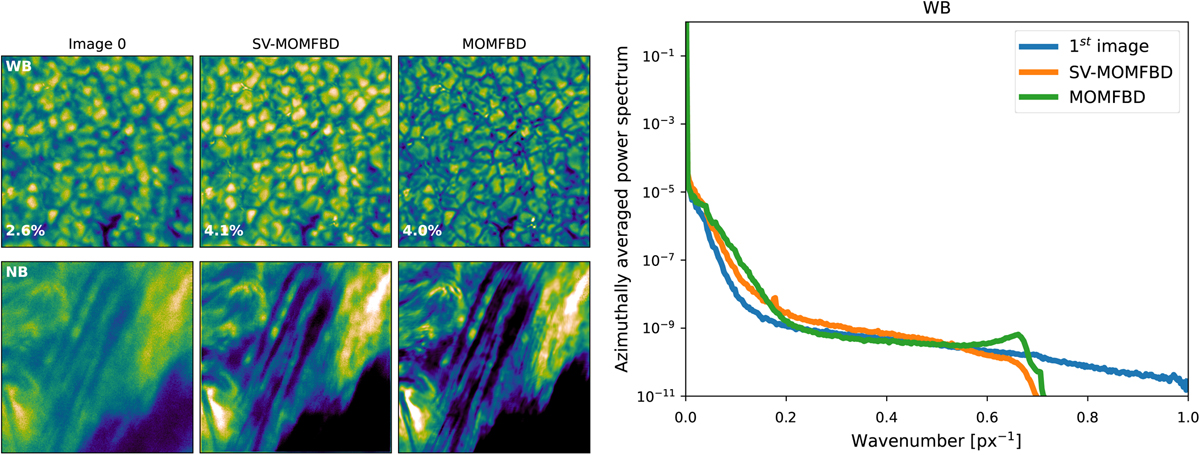
Example of reconstruction of HiFI data (left panel). The first column displays the first images of the burst in the WB and NB channels. The second and third columns show the reconstructed WB and NB images with our SV-MOMFBD and MOMFBD, respectively. The right panel shows the azimuthally averaged spatial power spectra for the WB channels.
Current usage metrics show cumulative count of Article Views (full-text article views including HTML views, PDF and ePub downloads, according to the available data) and Abstracts Views on Vision4Press platform.
Data correspond to usage on the plateform after 2015. The current usage metrics is available 48-96 hours after online publication and is updated daily on week days.
Initial download of the metrics may take a while.