Open Access
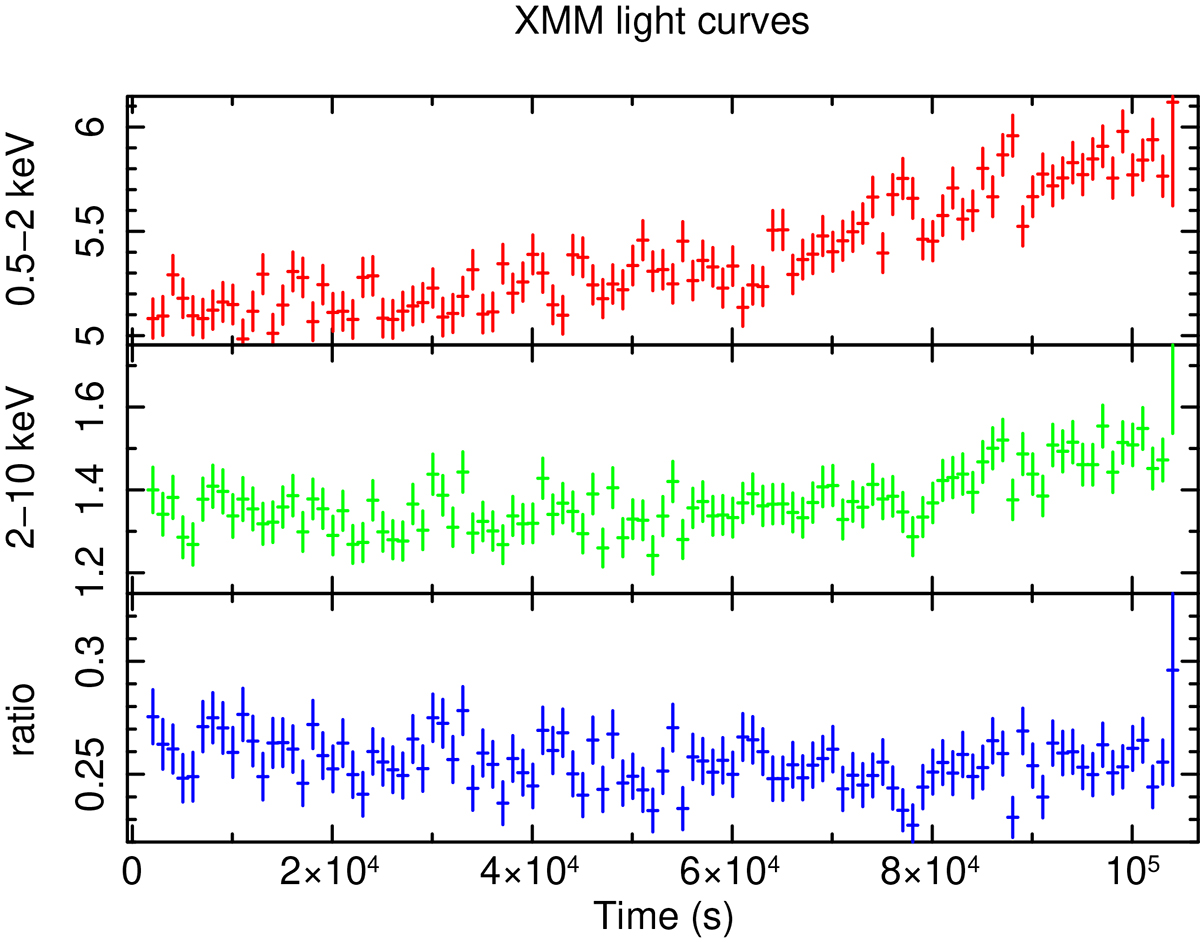
Fig. 1.
Download original image
XMM count rate light curves. Top panel: light curve for the energy interval 0.5 − 2 keV. Middle panel: light curve for the energy interval 2 − 10 keV. Bottom panel: ratio between the two energy band.
Current usage metrics show cumulative count of Article Views (full-text article views including HTML views, PDF and ePub downloads, according to the available data) and Abstracts Views on Vision4Press platform.
Data correspond to usage on the plateform after 2015. The current usage metrics is available 48-96 hours after online publication and is updated daily on week days.
Initial download of the metrics may take a while.