Fig. 8.
Download original image
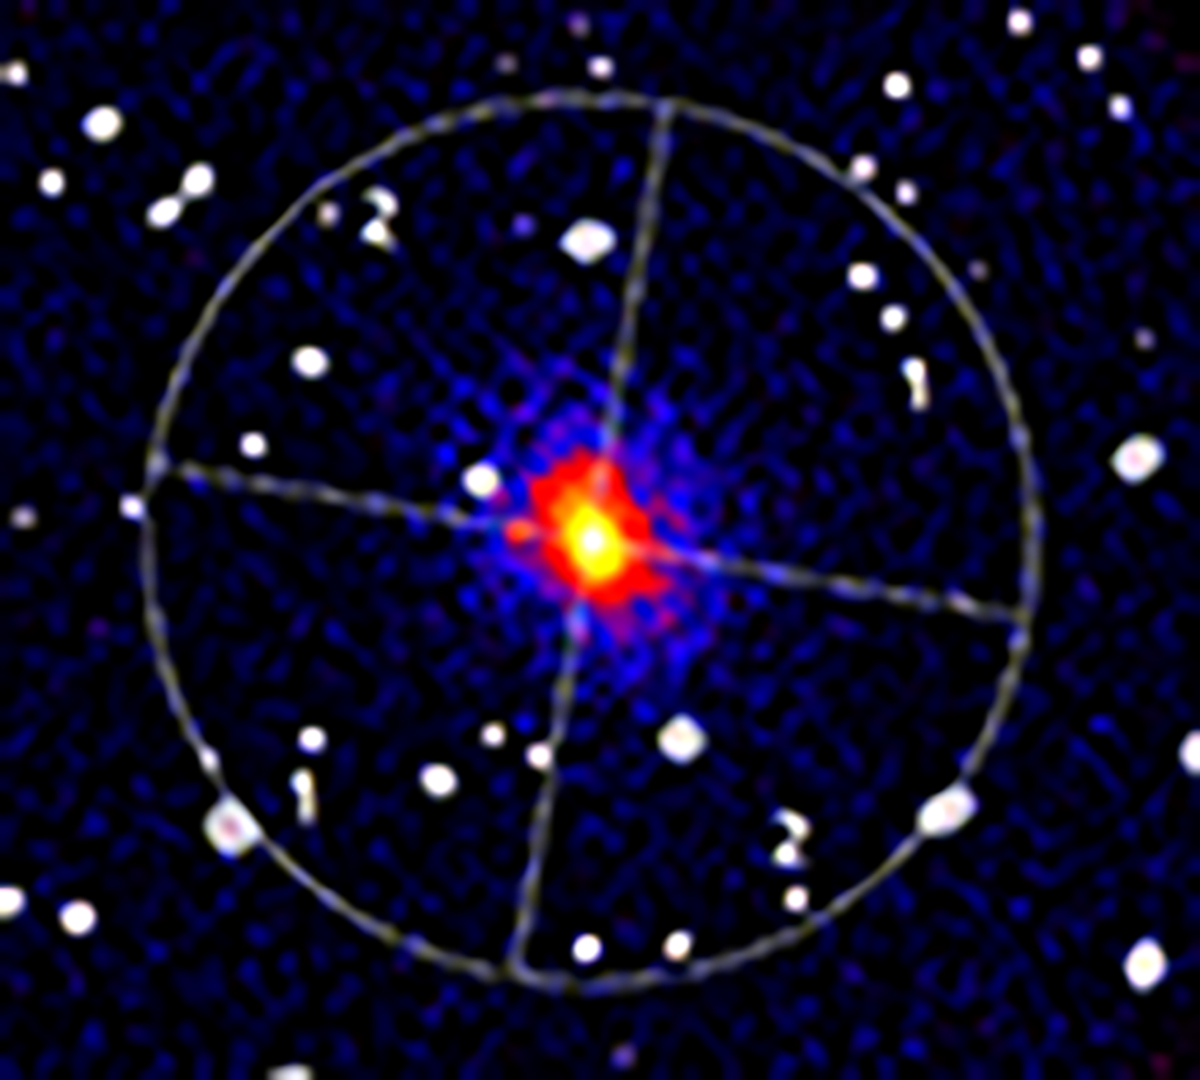
X-ray Chandra image after background subtraction, captured within the energy range of [0.5,2.5] keV. The dashed white circle denotes the position at a radius of ![]() . The white sector outlines the two distinct regions under separate analysis, each identified by a numerical label. The first region (labeled 1) corresponds to the sector aligned with the minor axis, while the second region (labeled 2) is oriented along the major axis. The shaded white areas represent the masked regions used to exclude point sources from the analysis.
. The white sector outlines the two distinct regions under separate analysis, each identified by a numerical label. The first region (labeled 1) corresponds to the sector aligned with the minor axis, while the second region (labeled 2) is oriented along the major axis. The shaded white areas represent the masked regions used to exclude point sources from the analysis.
Current usage metrics show cumulative count of Article Views (full-text article views including HTML views, PDF and ePub downloads, according to the available data) and Abstracts Views on Vision4Press platform.
Data correspond to usage on the plateform after 2015. The current usage metrics is available 48-96 hours after online publication and is updated daily on week days.
Initial download of the metrics may take a while.