Fig. 7.
Download original image
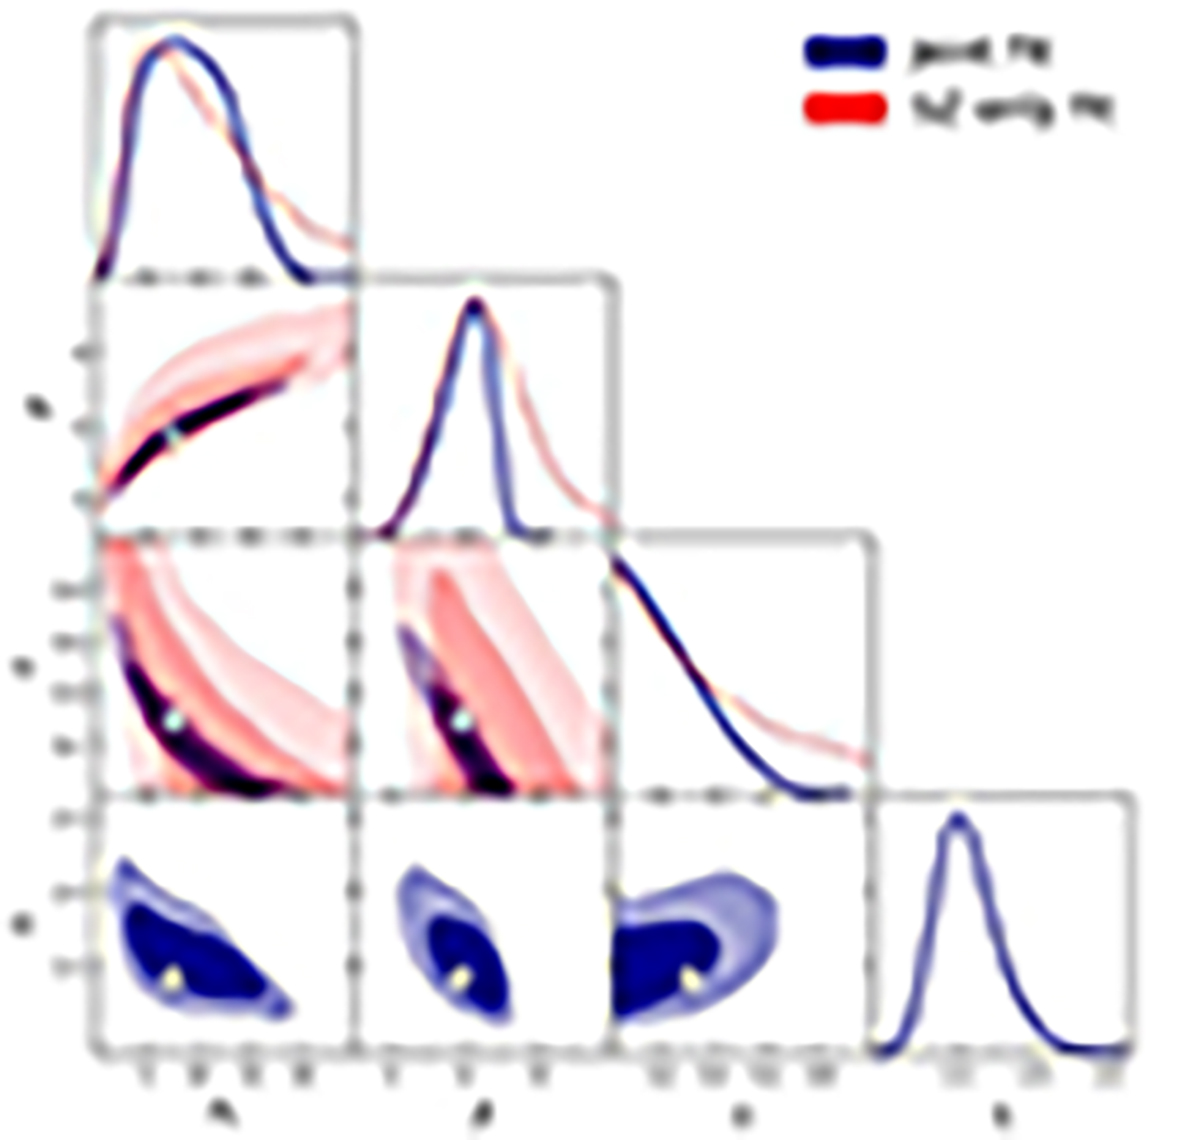
Corner plot illustrating the results of the MCMC analysis for the Nagai et al. (2007) model parameters and the normalization parameter. The joint fit is represented by the blue lines and contours, while the red lines represent the SZ-only fit. Each panel along the diagonal displays the marginalized posterior distribution for a single parameter, while the off-diagonal panels show the two-dimensional projections highlighting the covariances between parameter pairs. The contours represent the 68% and 95% confidence intervals. There is no red counterpart for the ηT parameter since it is not fitted in the SZ-only fit. The white crosses represent the position of the best-fit (maximum likelihood) parameters associated with the joint fit.
Current usage metrics show cumulative count of Article Views (full-text article views including HTML views, PDF and ePub downloads, according to the available data) and Abstracts Views on Vision4Press platform.
Data correspond to usage on the plateform after 2015. The current usage metrics is available 48-96 hours after online publication and is updated daily on week days.
Initial download of the metrics may take a while.