Fig. 6.
Download original image
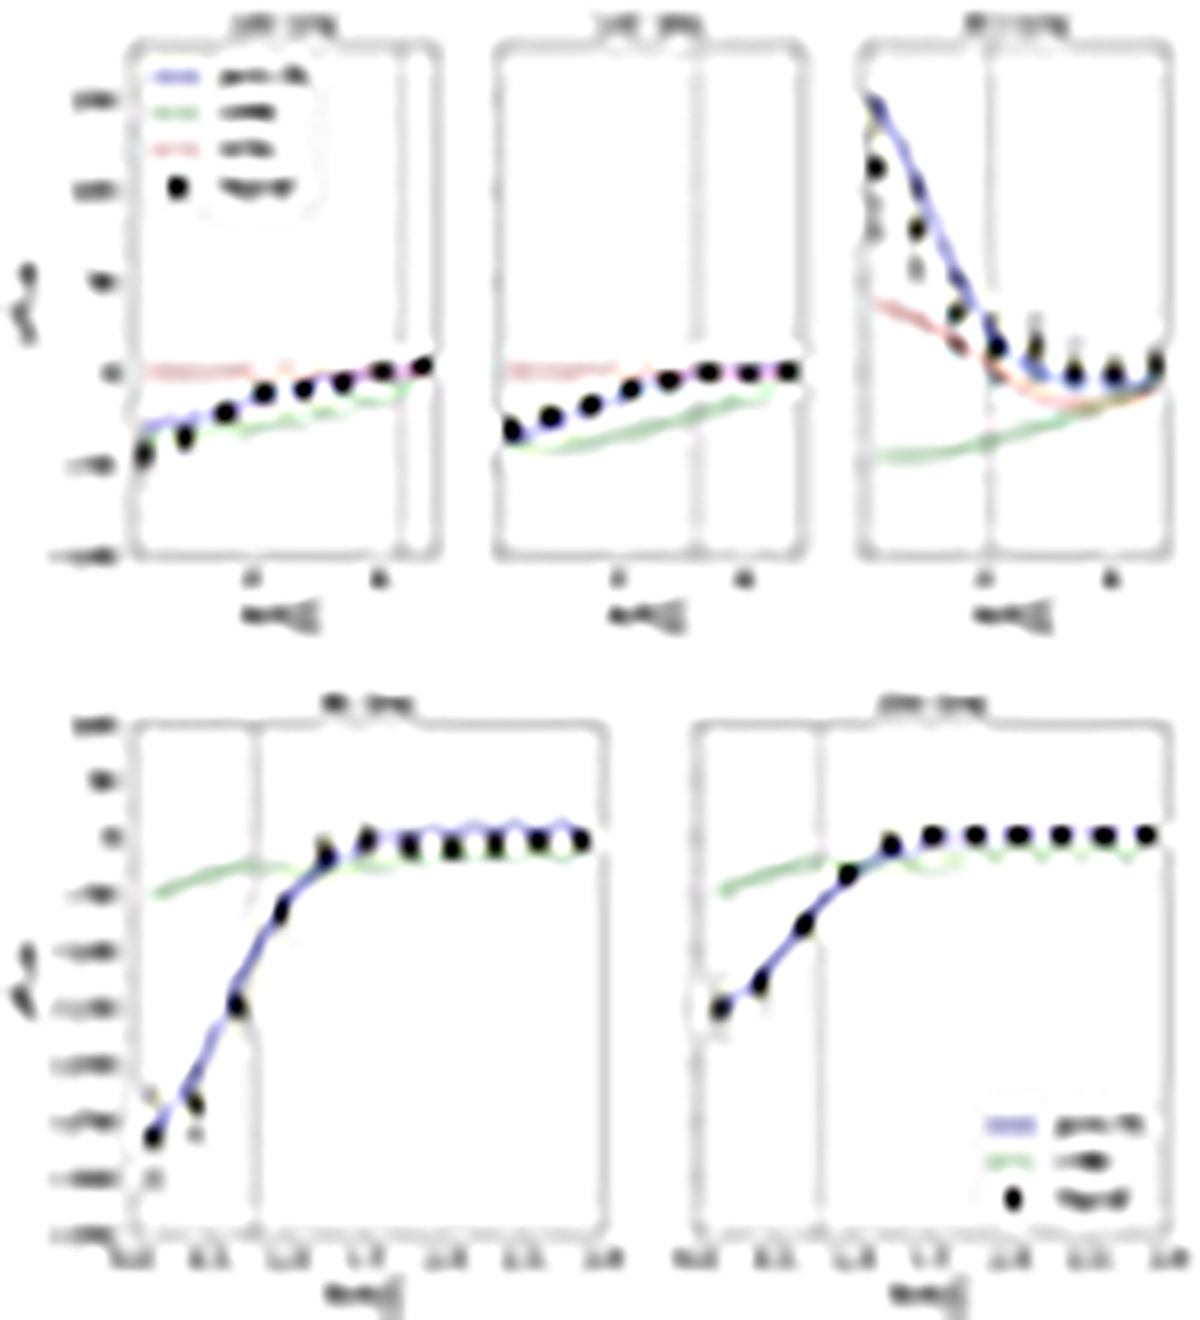
Radial profile of the SZ brightness around the X-ray peak of SPT-CLJ0615-5746 of the Planck (upper panels) and SPT (lower panels) channels used in the fitting procedure. The black dots represent the radial average values on the cleaned maps with their respective errors, and the green and brown lines represent the CMB and GTD. The blue line represents the best fit from the joint X-ray and millimetric analysis (Sect. 4.3). The vertical dashed lines indicate the FWHM of the beam in each frequency channel.
Current usage metrics show cumulative count of Article Views (full-text article views including HTML views, PDF and ePub downloads, according to the available data) and Abstracts Views on Vision4Press platform.
Data correspond to usage on the plateform after 2015. The current usage metrics is available 48-96 hours after online publication and is updated daily on week days.
Initial download of the metrics may take a while.