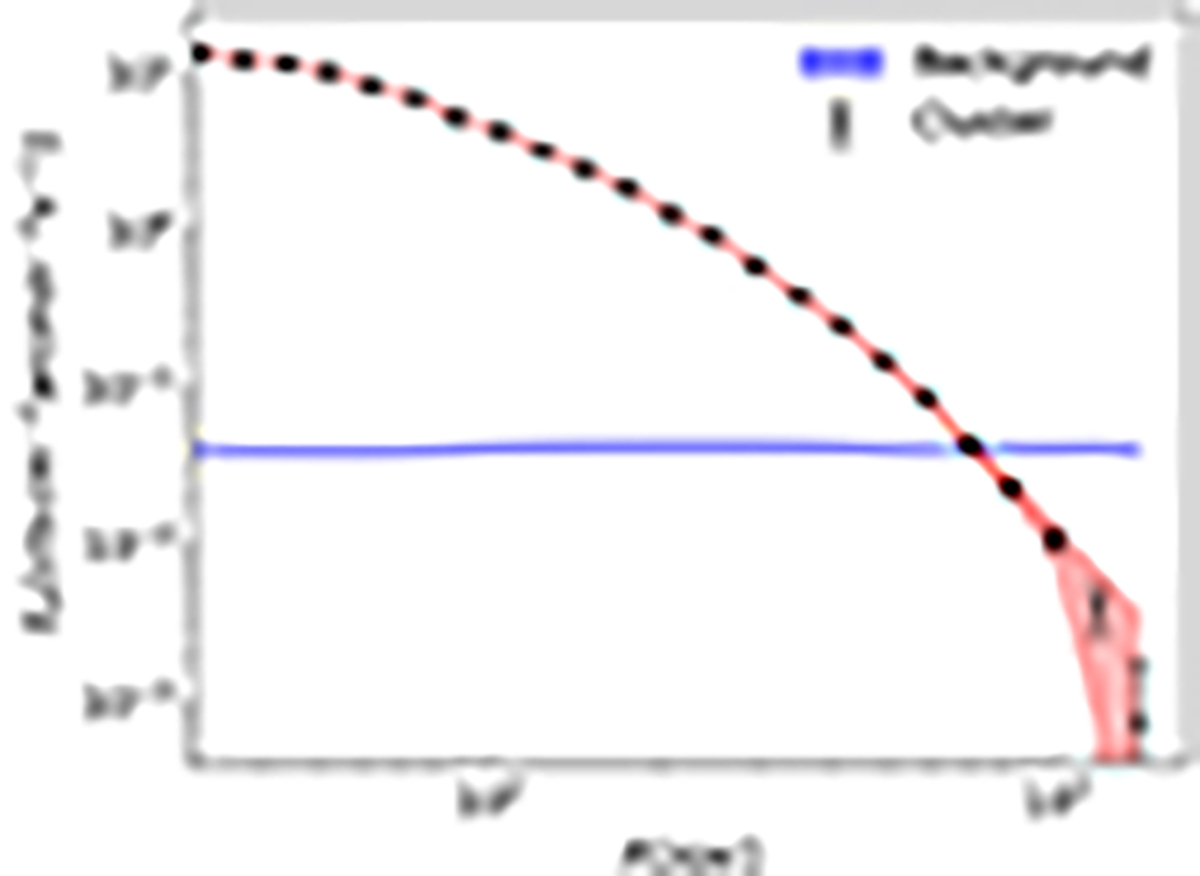
Fig. 4.
Download original image
Background-subtracted surface brightness profile of the Chandra data (black points) measured on SPT-CLJ0615-5746. The black bars represent the Poissonian statistical error associated with the measurement in each bin, while the shaded red regions represent the sum of the statistical and the 5% systematic error associated with the estimation of the background X-ray emission (shaded blue region).
Current usage metrics show cumulative count of Article Views (full-text article views including HTML views, PDF and ePub downloads, according to the available data) and Abstracts Views on Vision4Press platform.
Data correspond to usage on the plateform after 2015. The current usage metrics is available 48-96 hours after online publication and is updated daily on week days.
Initial download of the metrics may take a while.