Fig. 10.
Download original image
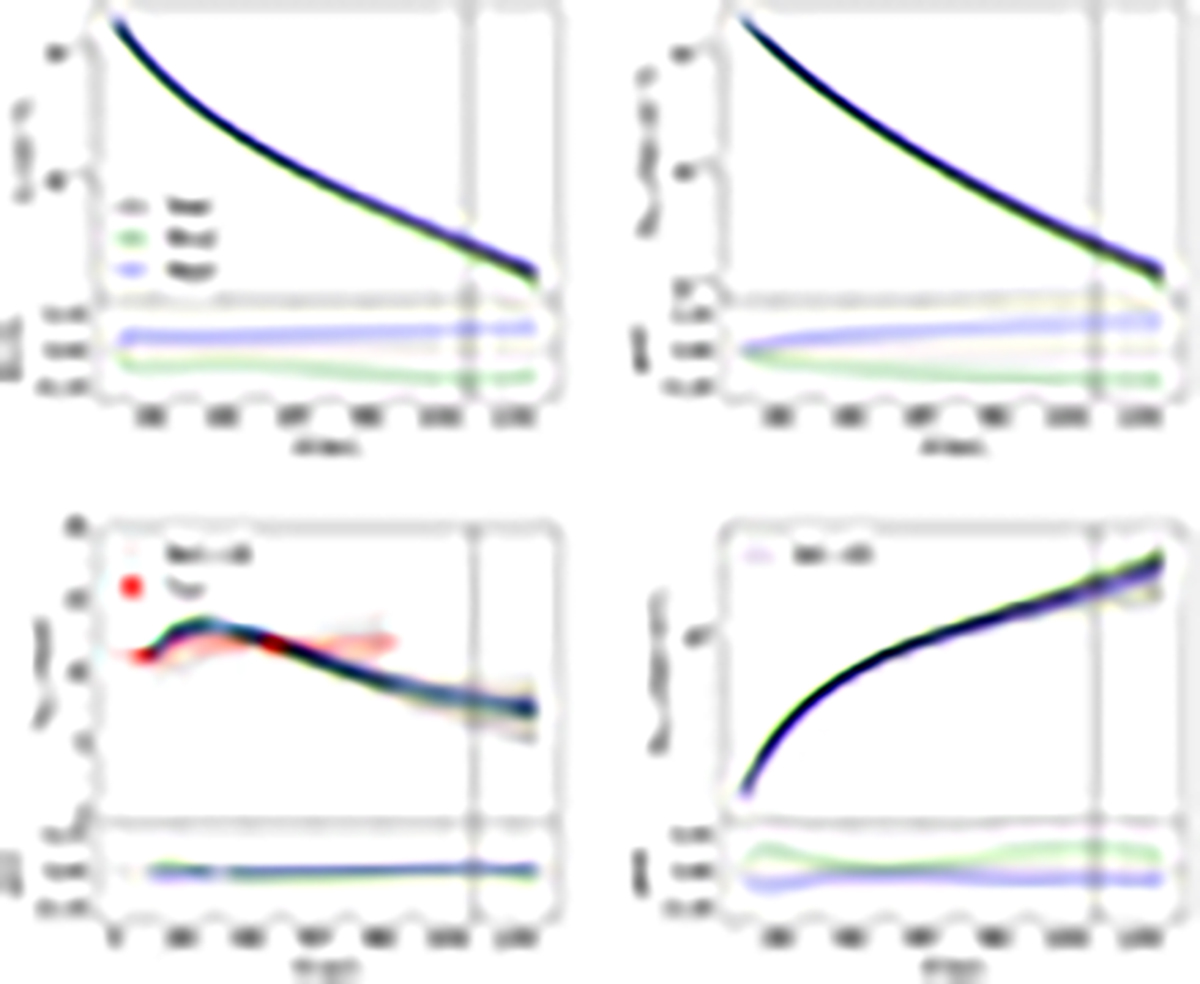
Thermodynamic profiles of SPT-CLJ0615-5746 for both total and angular sectors analysis. Top: Density and pressure profiles derived independently from the X-ray analysis and the joint fit, respectively. Bottom left: 3D temperature profile derived from the ideal gas law. The red points represent the spectroscopic temperature bins used in the joint fit. The brown dotted line shows the 3D temperature from Bartalucci et al. (2017), derived from a deprojection of the X-ray spectroscopic temperatures of this system. Bottom right: Cluster entropy profile derived from Eq. (15). The violet dotted line shows the theoretical entropy profiles from the gravity-only simulations of Voit et al. (2005). In each figure the black solid line represents the profile derived from the total density profile, while the green and blue lines represent the analysis conducted along the minor and major axes, respectively. The dashed section line marks the region inside the innermost Chandra spectroscopic temperature data point. The vertical dashed line represents the estimation of ![]() . The shaded region corresponds to the 68% credible interval. The bottom panels represent the fractional variation of the minor (green lines) and major (blue lines) axis profiles with respect to the total profile.
. The shaded region corresponds to the 68% credible interval. The bottom panels represent the fractional variation of the minor (green lines) and major (blue lines) axis profiles with respect to the total profile.
Current usage metrics show cumulative count of Article Views (full-text article views including HTML views, PDF and ePub downloads, according to the available data) and Abstracts Views on Vision4Press platform.
Data correspond to usage on the plateform after 2015. The current usage metrics is available 48-96 hours after online publication and is updated daily on week days.
Initial download of the metrics may take a while.