Fig. 1.
Download original image
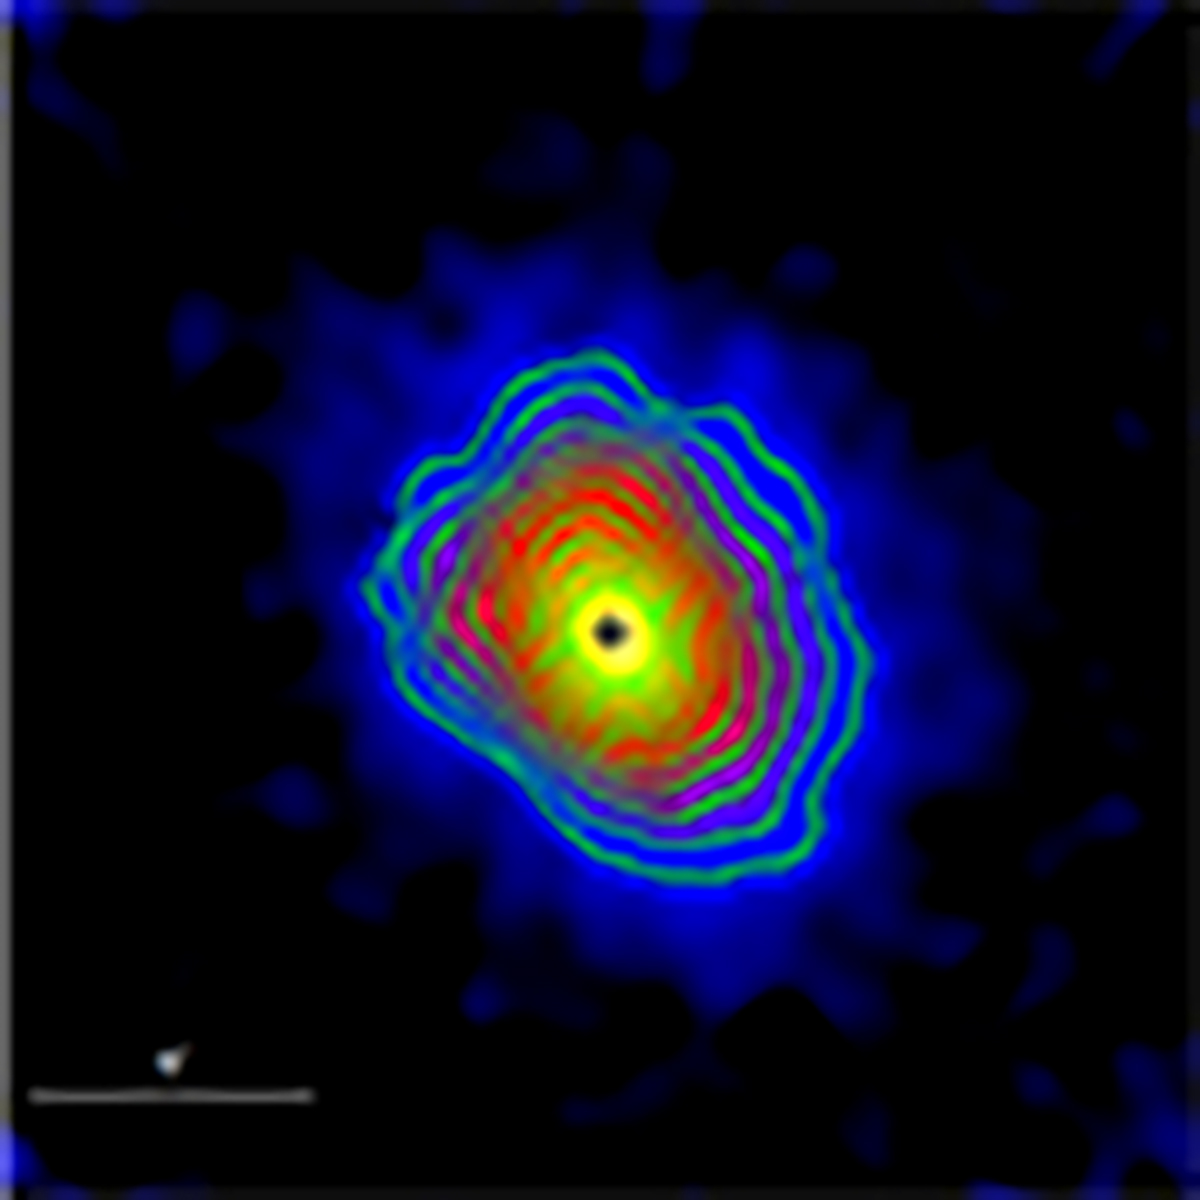
Wavelet-denoised image of the Chandra X-ray emission of SPT-CLJ0615-5746. The map shows the backgroud-subtracted surface brightness computed in the energy range [0.5, 2.5] keV. It covers an area of ![]() from the position of the X-ray peak (black cross). The surface brightness isocontour levels (green lines) are logarithmically equispaced by a factor
from the position of the X-ray peak (black cross). The surface brightness isocontour levels (green lines) are logarithmically equispaced by a factor ![]() .
.
Current usage metrics show cumulative count of Article Views (full-text article views including HTML views, PDF and ePub downloads, according to the available data) and Abstracts Views on Vision4Press platform.
Data correspond to usage on the plateform after 2015. The current usage metrics is available 48-96 hours after online publication and is updated daily on week days.
Initial download of the metrics may take a while.