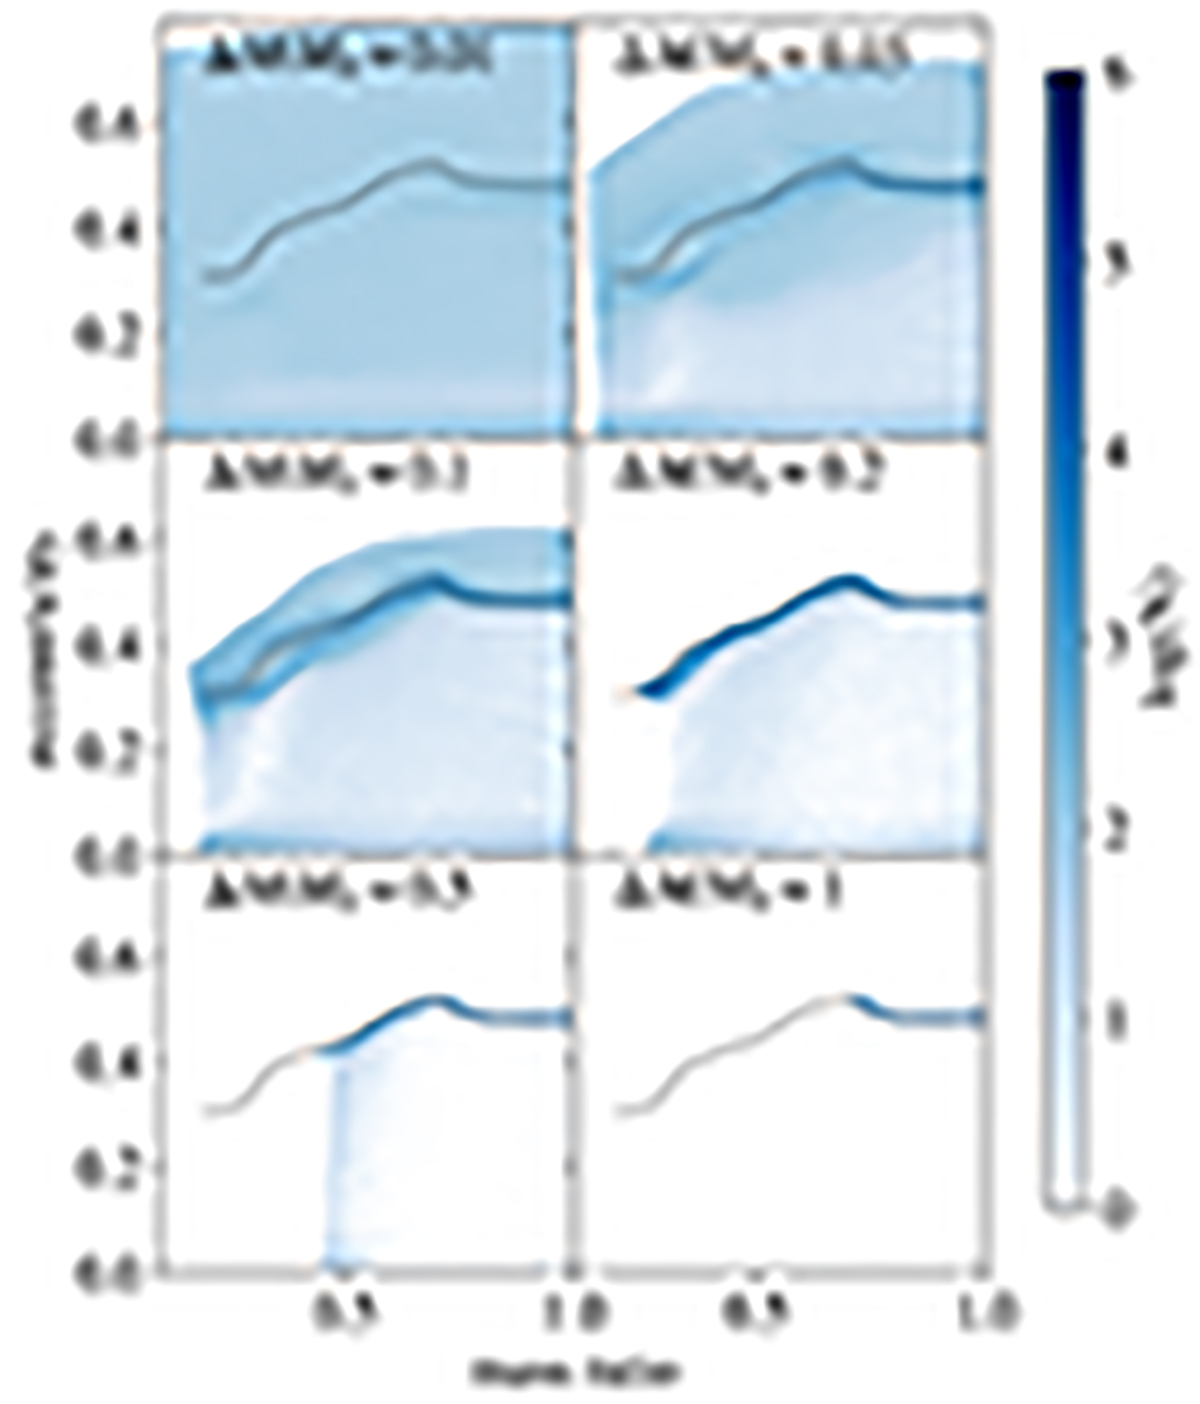
Fig. 6.
Download original image
Population synthesis of binaries interacting with circumbinary disks in the e-q plane. Each panel corresponds to a different amount of accreted mass, increasing from top-left to bottom-right. The color scale indicates the number of systems falling into each bin. The gray band marks the position of the equilibrium eccentricity.
Current usage metrics show cumulative count of Article Views (full-text article views including HTML views, PDF and ePub downloads, according to the available data) and Abstracts Views on Vision4Press platform.
Data correspond to usage on the plateform after 2015. The current usage metrics is available 48-96 hours after online publication and is updated daily on week days.
Initial download of the metrics may take a while.