Fig. 1.
Download original image
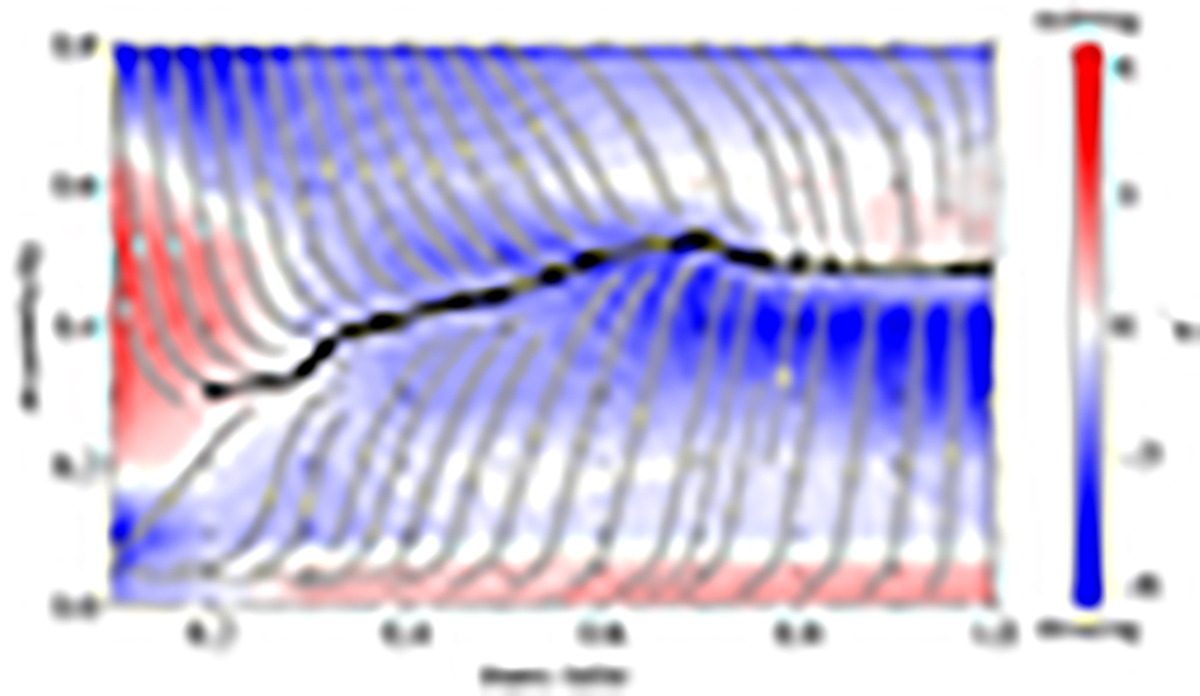
Orbital evolution of binary systems under interaction with a circumbinary disk. The white lines follow the trajectories in the eccentricity–mass ratio plane. The thick black line traces the equilibrium eccentricity, that is the region where, for a fixed mass ratio q, the eccentricity derivative is e′ = 0. The background color shows our interpolated function approximating the derivative of the separation a′≡dlog a/dlog M. This quantity shows how fast the separation changes per unit of accreted mass. Regions where the orbit shrinks are shown in blue and regions where the orbit widens in red. The small black dots in the background correspond to the parameters used in the hydrodynamic simulations by S23b, on which the interpolation is based.
Current usage metrics show cumulative count of Article Views (full-text article views including HTML views, PDF and ePub downloads, according to the available data) and Abstracts Views on Vision4Press platform.
Data correspond to usage on the plateform after 2015. The current usage metrics is available 48-96 hours after online publication and is updated daily on week days.
Initial download of the metrics may take a while.