Fig. 7
Download original image
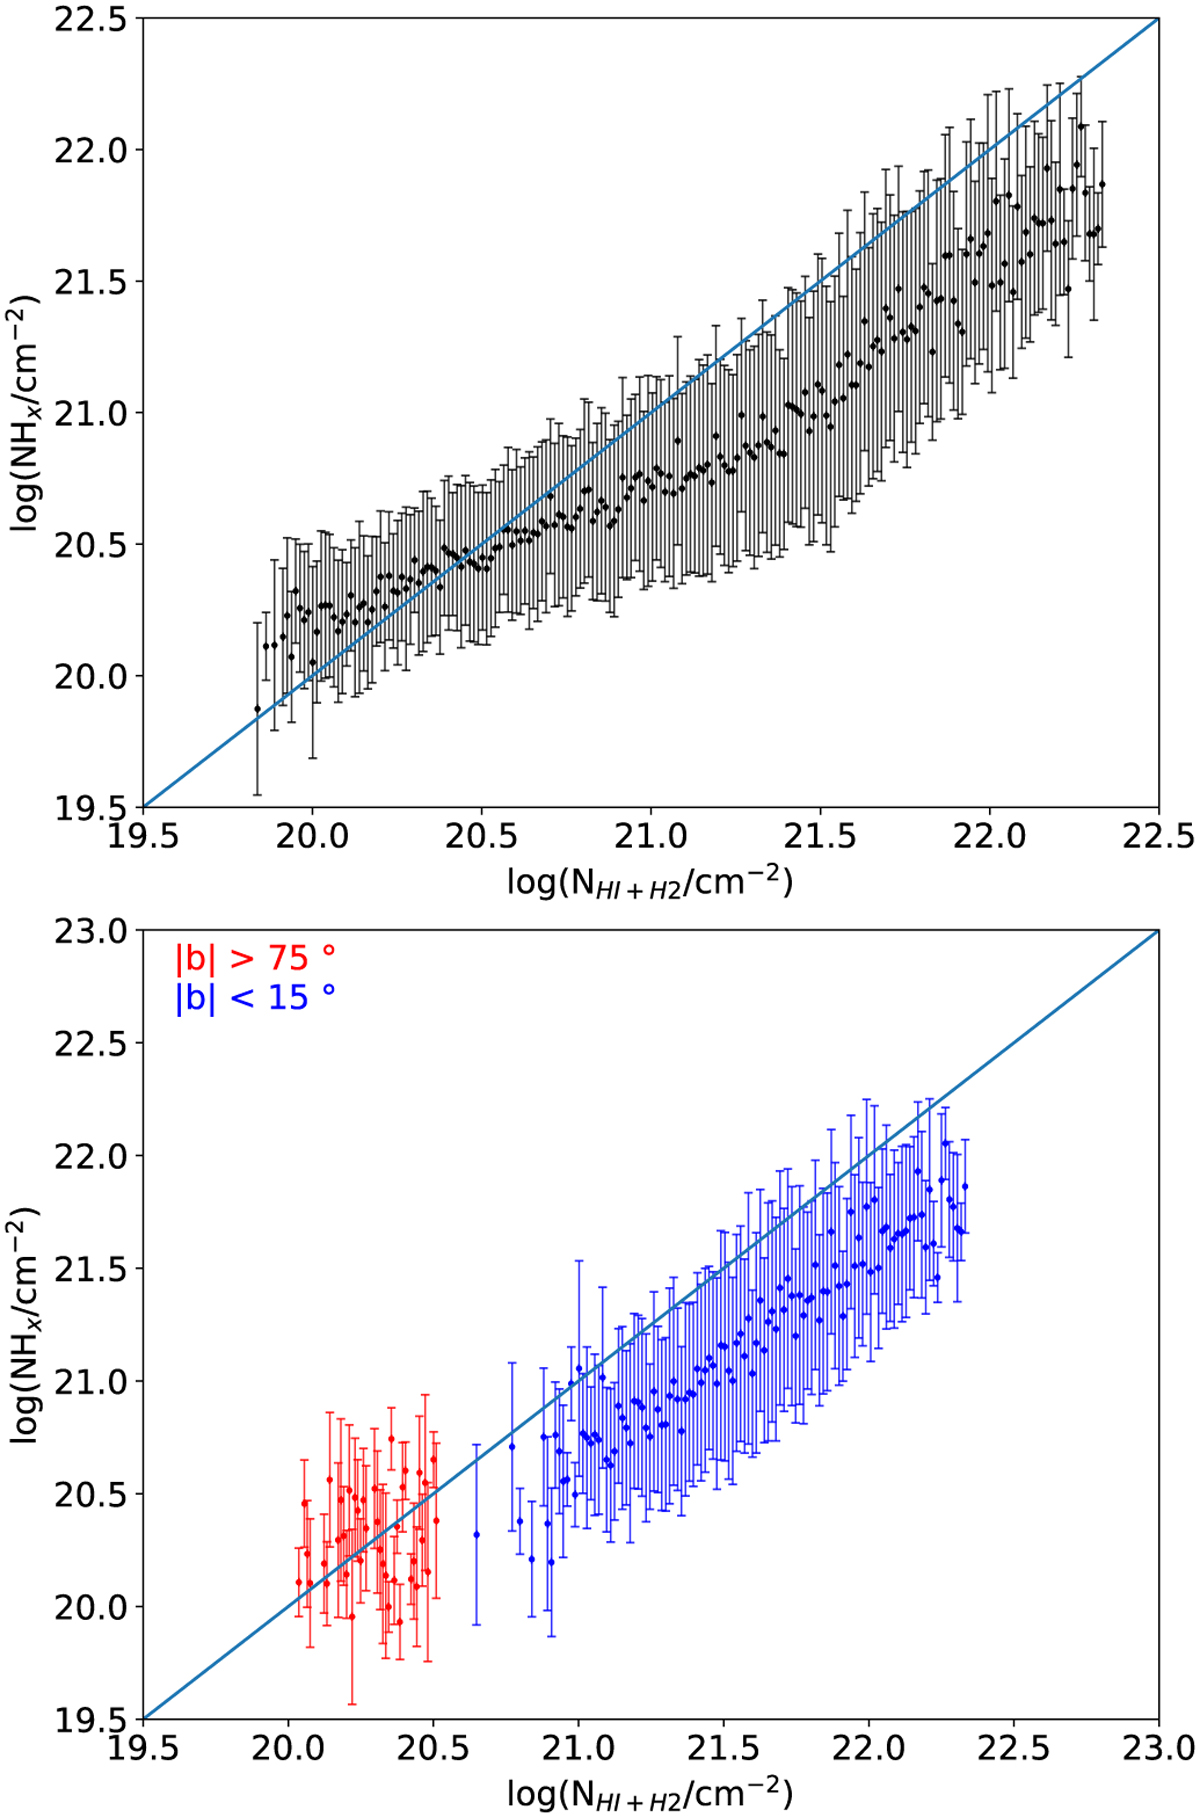
Comparison between ![]() and
and ![]() measurements. Top panel: comparison between the
measurements. Top panel: comparison between the ![]() values obtained from the best fits and the
values obtained from the best fits and the ![]() measured in the lines of sight. The log(
measured in the lines of sight. The log(![]() )/log(
)/log(![]() ) = 1 ratio is plotted with a solid blue line. The data has been rebinned for illustrative purposes. Bottom panel: same as the top panel but including only high-latitude sources (|b| > 75°, red color) and low-latitude sources (|b| < 15°, blue color).
) = 1 ratio is plotted with a solid blue line. The data has been rebinned for illustrative purposes. Bottom panel: same as the top panel but including only high-latitude sources (|b| > 75°, red color) and low-latitude sources (|b| < 15°, blue color).
Current usage metrics show cumulative count of Article Views (full-text article views including HTML views, PDF and ePub downloads, according to the available data) and Abstracts Views on Vision4Press platform.
Data correspond to usage on the plateform after 2015. The current usage metrics is available 48-96 hours after online publication and is updated daily on week days.
Initial download of the metrics may take a while.