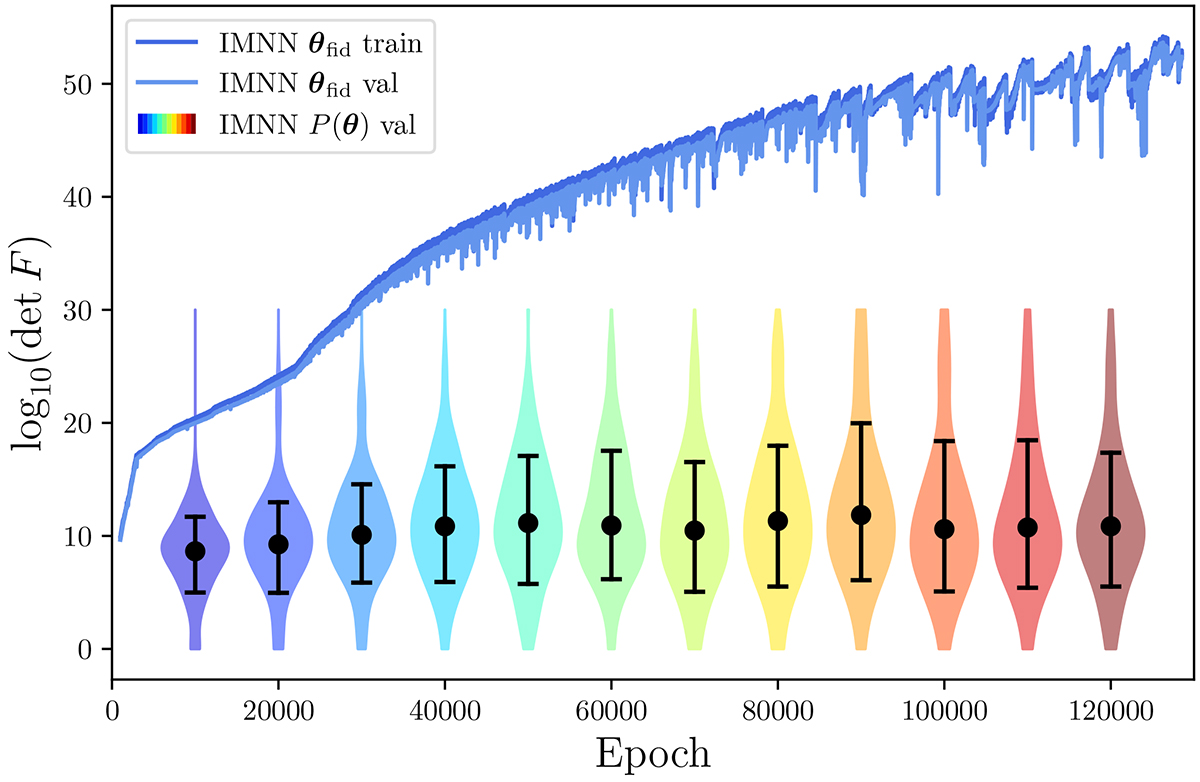
Fig. 6.
Download original image
Fisher information of the IMNN during training. Dark (light) blue curves show the Fisher information for the training (validation) set of the IMNN trained at θfid. The violin plots show the distribution of the Fisher information over the full prior volume excluding θfid, P(θ), at every interval of the 10k training epochs. Black dots and error bars inside each violin denote the median and 68% CLs of the distributions. The divergence between the Fisher information computed at θfid and its PDF over the remaining prior volume clearly indicates that the IMNN is over-specializing to the specific parameter combination, θfid, used in the training.
Current usage metrics show cumulative count of Article Views (full-text article views including HTML views, PDF and ePub downloads, according to the available data) and Abstracts Views on Vision4Press platform.
Data correspond to usage on the plateform after 2015. The current usage metrics is available 48-96 hours after online publication and is updated daily on week days.
Initial download of the metrics may take a while.