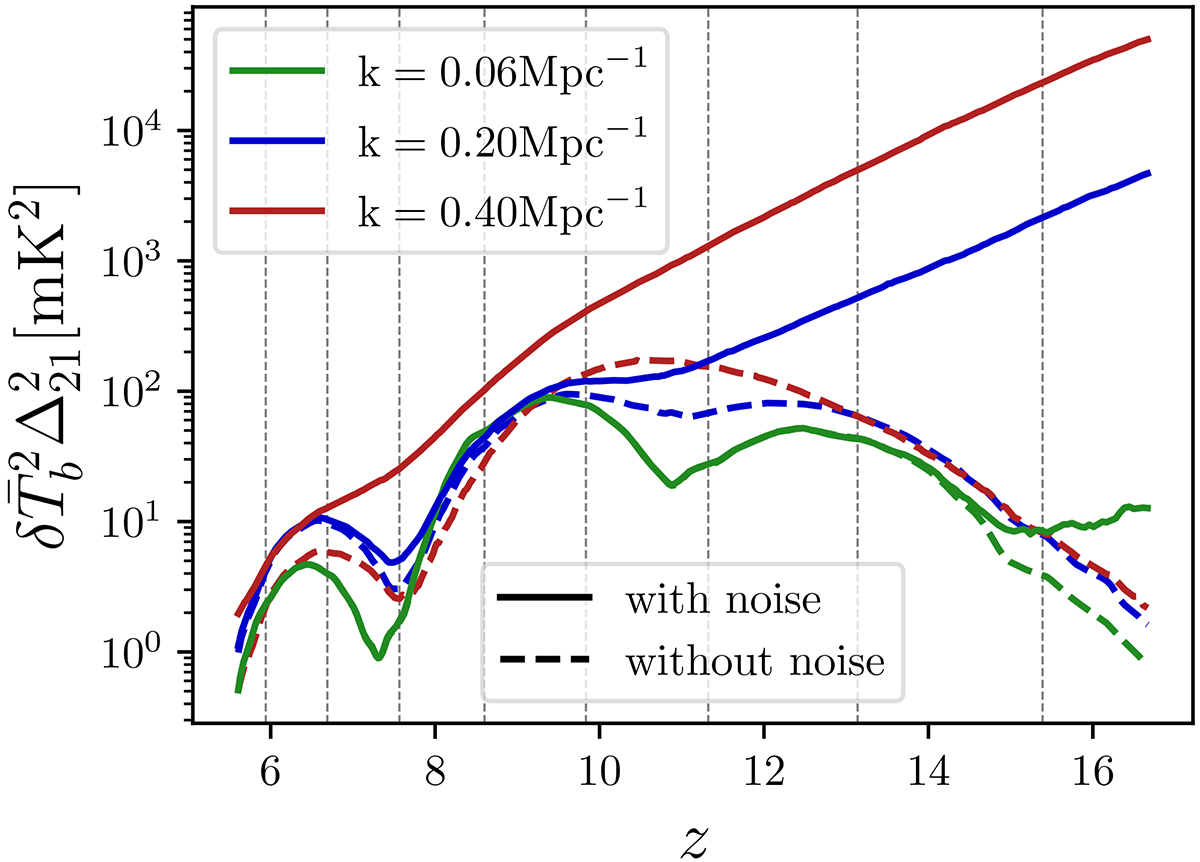
Fig. 2.
Download original image
1DPS for the fiducial light cone shown in Figure 1. Different colors correspond to different wave modes, while solid (dashed) lines correspond to light cones with (without) noise. Comparing the solid and dashed lines, we see that the signal is noise dominated at higher k modes and redshifts (see also Fig. 1). All power spectra are computed from comoving cubes extracted from the light cone, centered on the redshifts indicated by the vertical dashed lines.
Current usage metrics show cumulative count of Article Views (full-text article views including HTML views, PDF and ePub downloads, according to the available data) and Abstracts Views on Vision4Press platform.
Data correspond to usage on the plateform after 2015. The current usage metrics is available 48-96 hours after online publication and is updated daily on week days.
Initial download of the metrics may take a while.