Fig. 5
Download original image
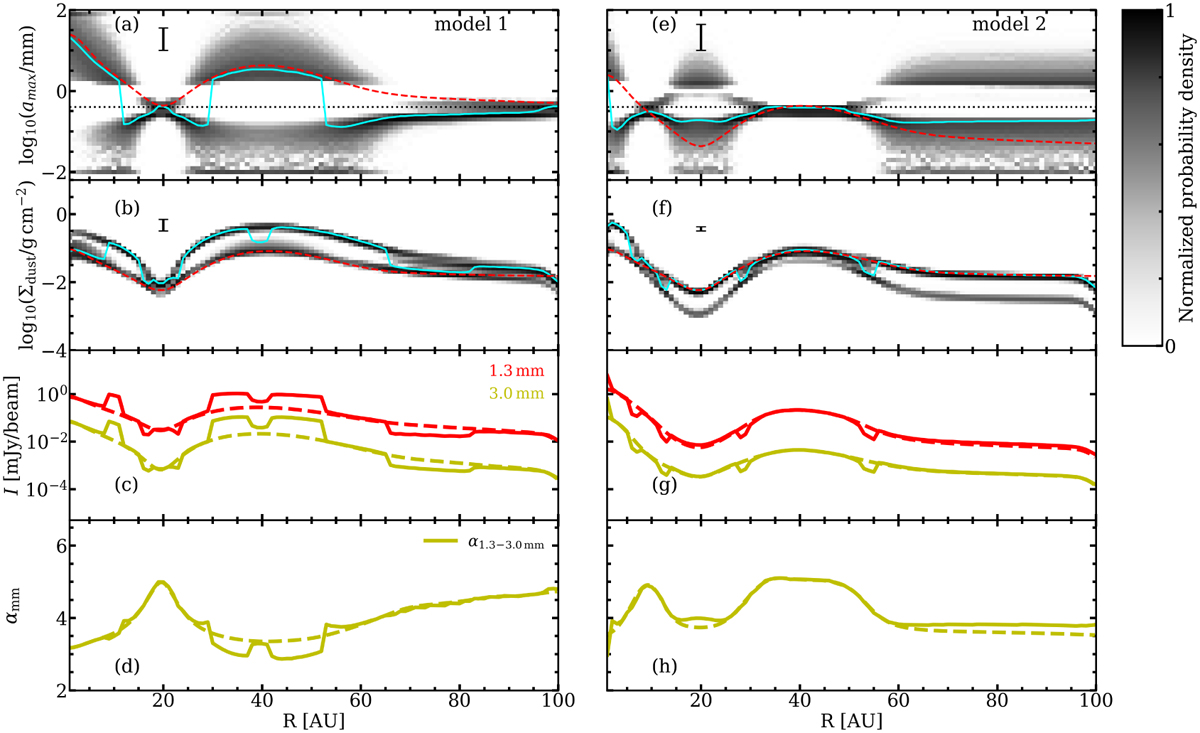
Results of fitting to the 1.3 mm and 3.0 mm images for model 1 (left column) and model 2 (right column). For model 1, the best-fit amax and ∑dust are indicated with the solid cyan lines in panels a and b, respectively, whereas the dashed red lines refer to the reference profiles convolved with a same beam (i.e., 0.05″) to that of the synthetic images. The gray color scale represents the probability distribution of parameter values returned from fitting the 5000 randomly generated intensity profiles (see Sec. 3). The vertical bar marks the typical confidence interval of the best-fit parameter set. In panels c and d, the reference profiles of intensity and spectral index are shown with dashed lines, while the best-fit results are indicated with solid lines. Panels e–h present the results for model 2.
Current usage metrics show cumulative count of Article Views (full-text article views including HTML views, PDF and ePub downloads, according to the available data) and Abstracts Views on Vision4Press platform.
Data correspond to usage on the plateform after 2015. The current usage metrics is available 48-96 hours after online publication and is updated daily on week days.
Initial download of the metrics may take a while.