Fig. 4
Download original image
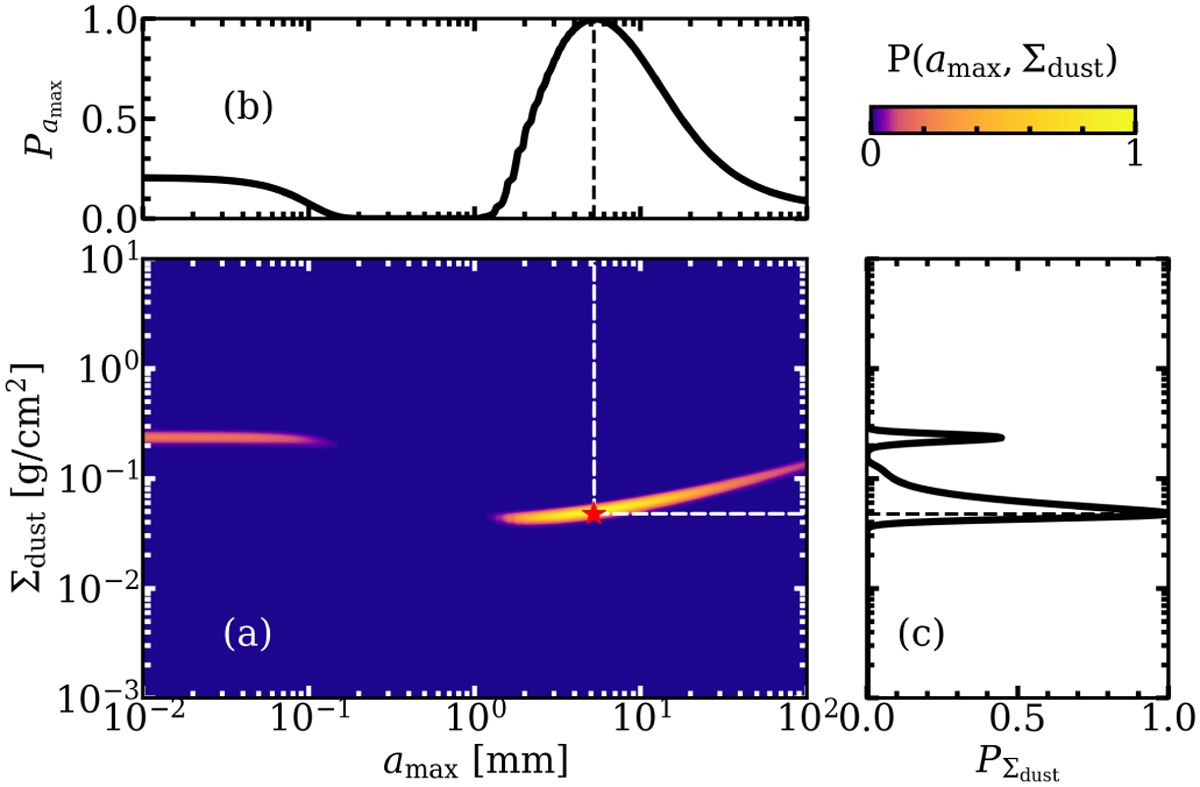
Fitting process for model 1 at R = 5 AU. The normalized joint probability distribution is shown as the color map in panel a. The marginalized probabilities for amax and ∑dust are indicated with the black lines in panels b and c, respectively. The red star denotes the best-fit parameter set identified from the fitting procedure.
Current usage metrics show cumulative count of Article Views (full-text article views including HTML views, PDF and ePub downloads, according to the available data) and Abstracts Views on Vision4Press platform.
Data correspond to usage on the plateform after 2015. The current usage metrics is available 48-96 hours after online publication and is updated daily on week days.
Initial download of the metrics may take a while.