Fig. 2
Download original image
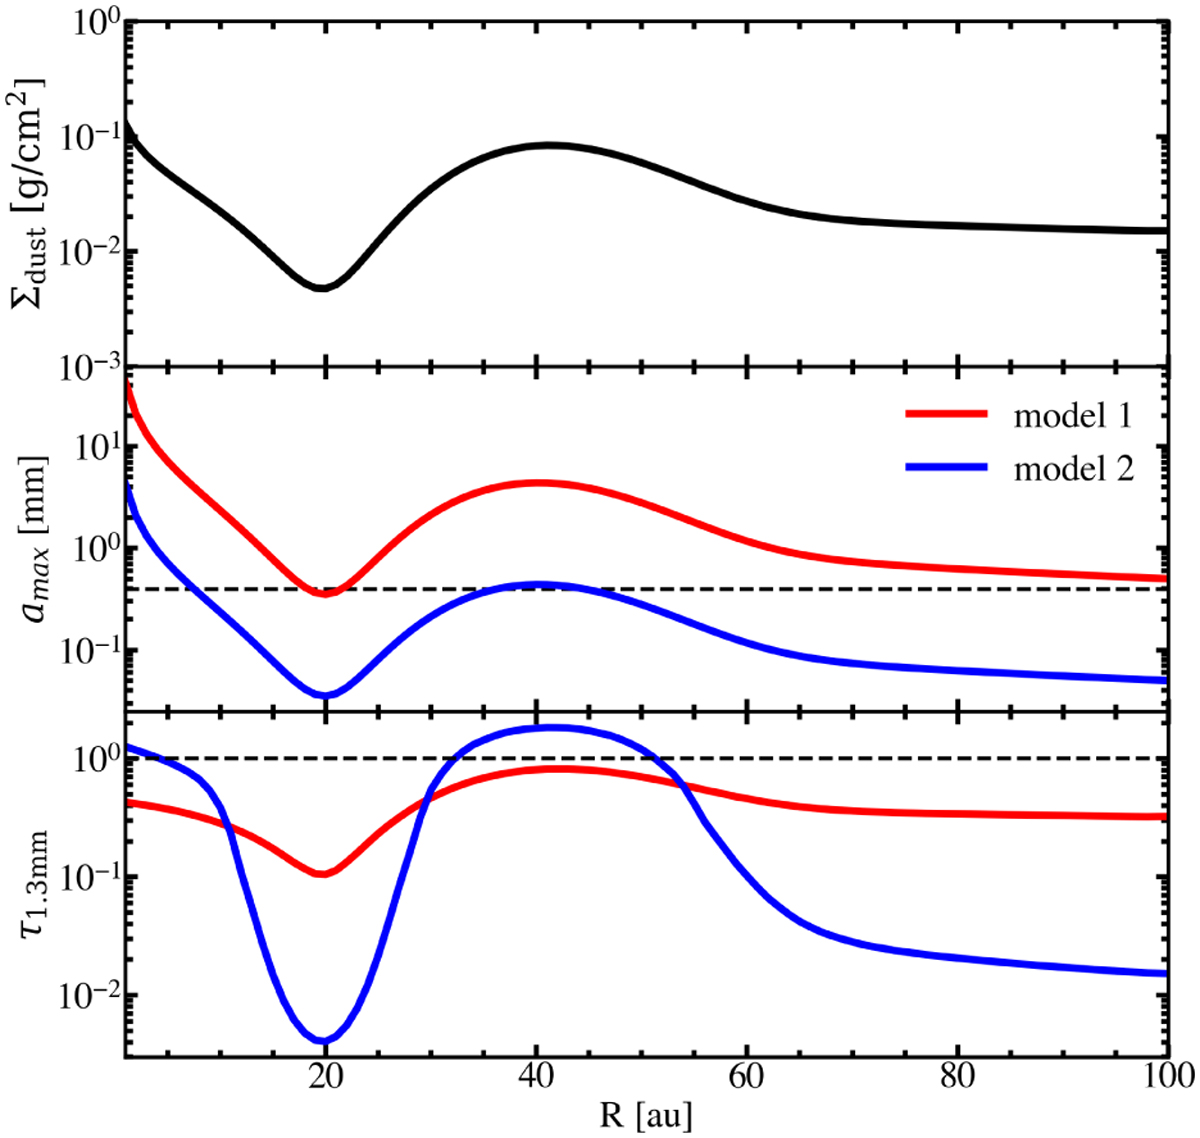
Properties of the reference models. Top panel: dust surface density. The dust surface densities of model 1 and model 2 are the same. Middle panel: radial profile of the maximum grain size of model 1 (red line) and model 2 (blue line). The horizontal dashed line marks the 0.4 mm boundary defined in Fig. 1. Bottom panel: optical depth at the wavelength of 1.3 mm. The color coding is identical to that in the middle panel. The τ1.3mm = 1 condition is indicated with the horizontal dashed line.
Current usage metrics show cumulative count of Article Views (full-text article views including HTML views, PDF and ePub downloads, according to the available data) and Abstracts Views on Vision4Press platform.
Data correspond to usage on the plateform after 2015. The current usage metrics is available 48-96 hours after online publication and is updated daily on week days.
Initial download of the metrics may take a while.