Fig. 1
Download original image
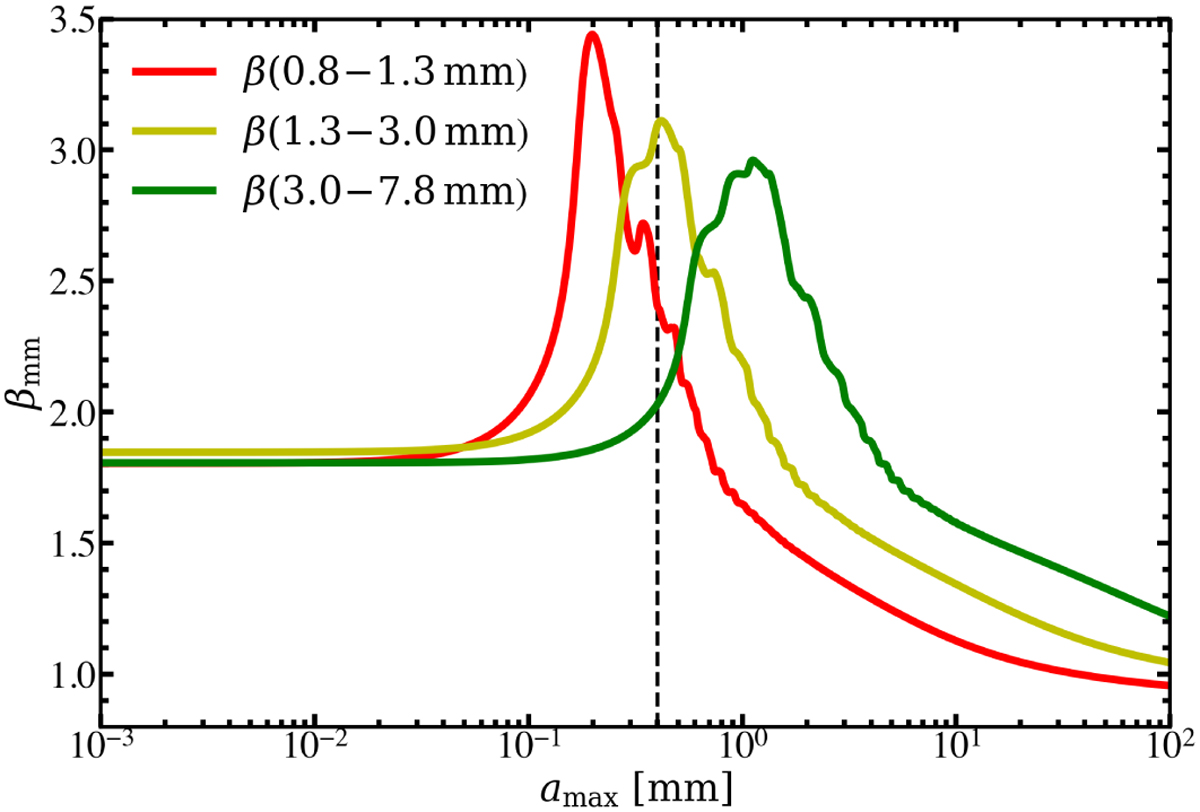
Dust opacity slope, βmm, as a function of the maximum grain size, amax. The slopes between two wavelengths given in the legend are derived by calculating the mass absorption coefficients (κabs). To calculate κabs, we adopted the MIE scattering theory, assuming the DSHARP dust composition (see Sec. 2.3). The grain size distribution follows a power law, N(a) ∝ a−3.5, with the minimum dust size fixed to amin = 0.01 μm. The vertical dashed line marks the 0.4 mm boundary that divides the amax values into two regimes (a small size region and a large size region) according to the β(1.3–3 mm) curve.
Current usage metrics show cumulative count of Article Views (full-text article views including HTML views, PDF and ePub downloads, according to the available data) and Abstracts Views on Vision4Press platform.
Data correspond to usage on the plateform after 2015. The current usage metrics is available 48-96 hours after online publication and is updated daily on week days.
Initial download of the metrics may take a while.