Fig. 8.
Download original image
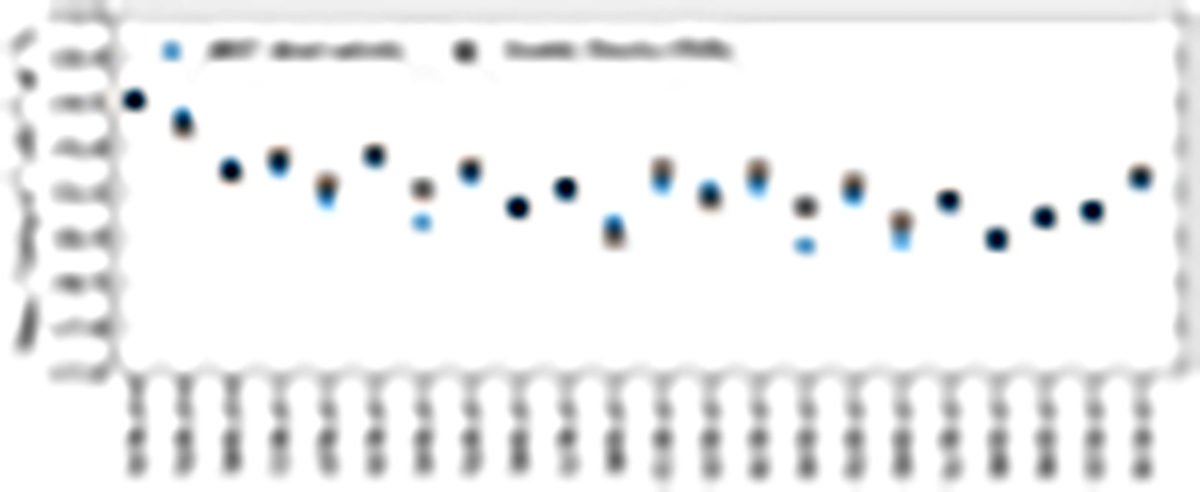
Comparison of the intensities of the H2 lines predicted by the fiducial model with the new JWST data observed by Leftley et al. 2024, which are corrected here by a factor (1 + z)3 (see Eq. (B.1)). Observations are shown as blue stars and the model predictions as open black circles. We emphasize that the model is obtained by fitting the Spitzer and VLT/SINFONI data, and not the JWST data.
Current usage metrics show cumulative count of Article Views (full-text article views including HTML views, PDF and ePub downloads, according to the available data) and Abstracts Views on Vision4Press platform.
Data correspond to usage on the plateform after 2015. The current usage metrics is available 48-96 hours after online publication and is updated daily on week days.
Initial download of the metrics may take a while.