Fig. 8.
Download original image
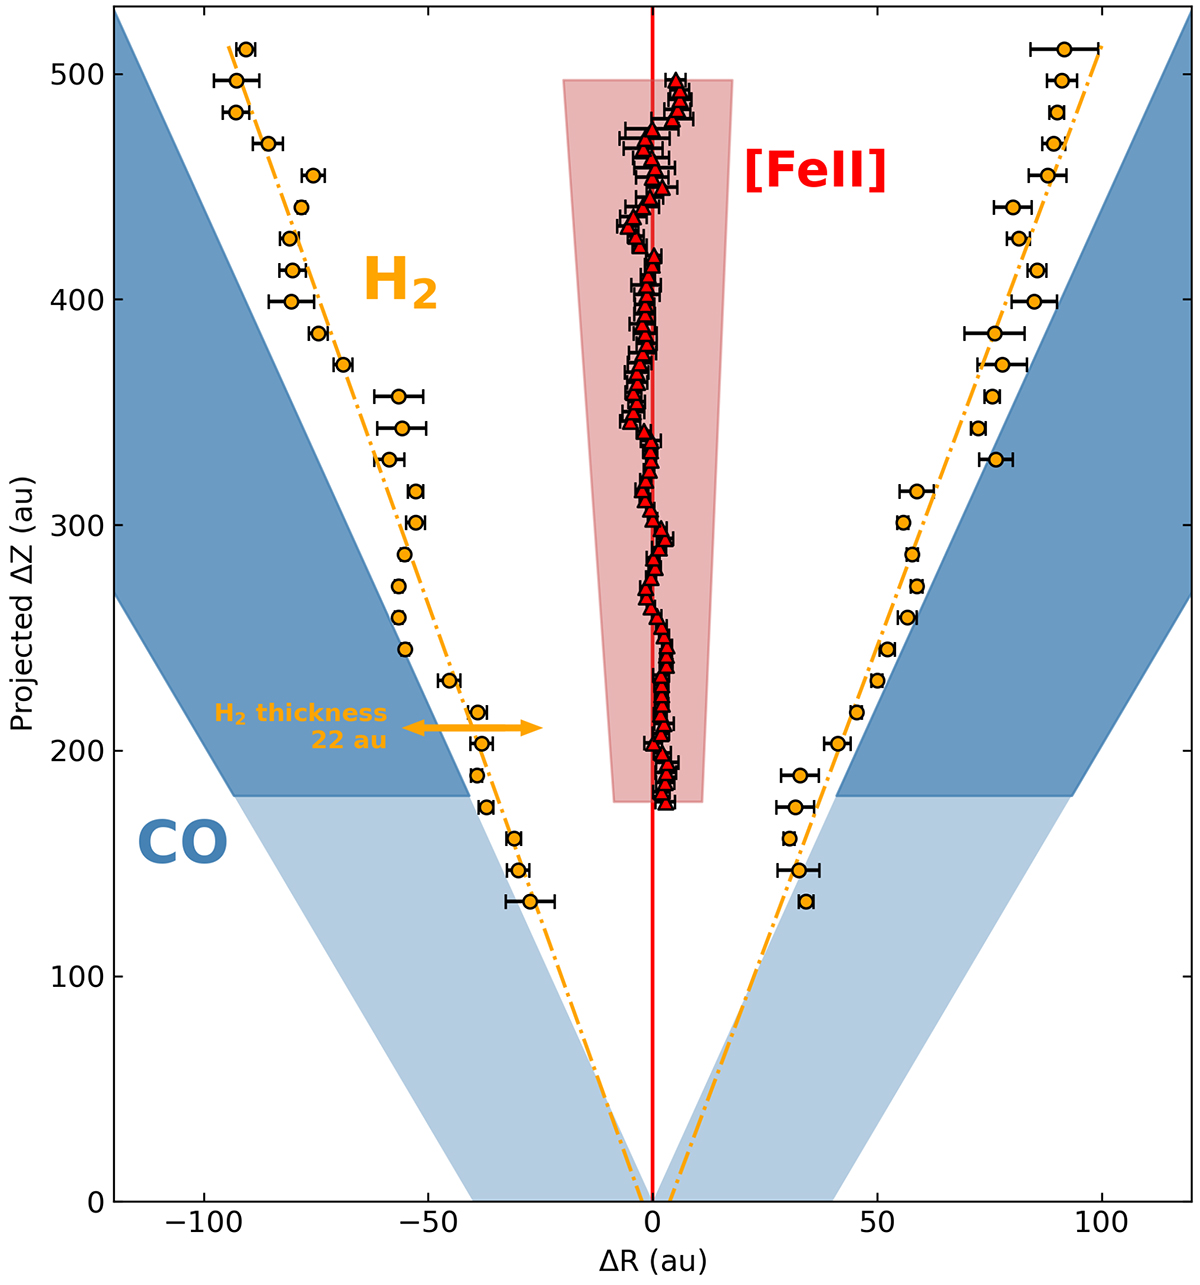
Collimation of the DG Tau B redshifted outflows. The orange dots show the derived positions of the H2 edges from the NIRSpec map. The red filled area indicates the full jet opening angle and the red dots trace the jet axis positions both derived from the F164N NIRCam image. The filled blue conical area show the projected outlines of the outer and inner limits derived by DV22 for the bright conical CO outflow. The light blue areas below ∼180 au correspond to the extrapolated CO flow edges, where no measurements are available. All error bars are 3σ. The double yellow arrow shows the thickness of the H2 cavity estimated in Sect. 3.1.1.
Current usage metrics show cumulative count of Article Views (full-text article views including HTML views, PDF and ePub downloads, according to the available data) and Abstracts Views on Vision4Press platform.
Data correspond to usage on the plateform after 2015. The current usage metrics is available 48-96 hours after online publication and is updated daily on week days.
Initial download of the metrics may take a while.