Fig. 7.
Download original image
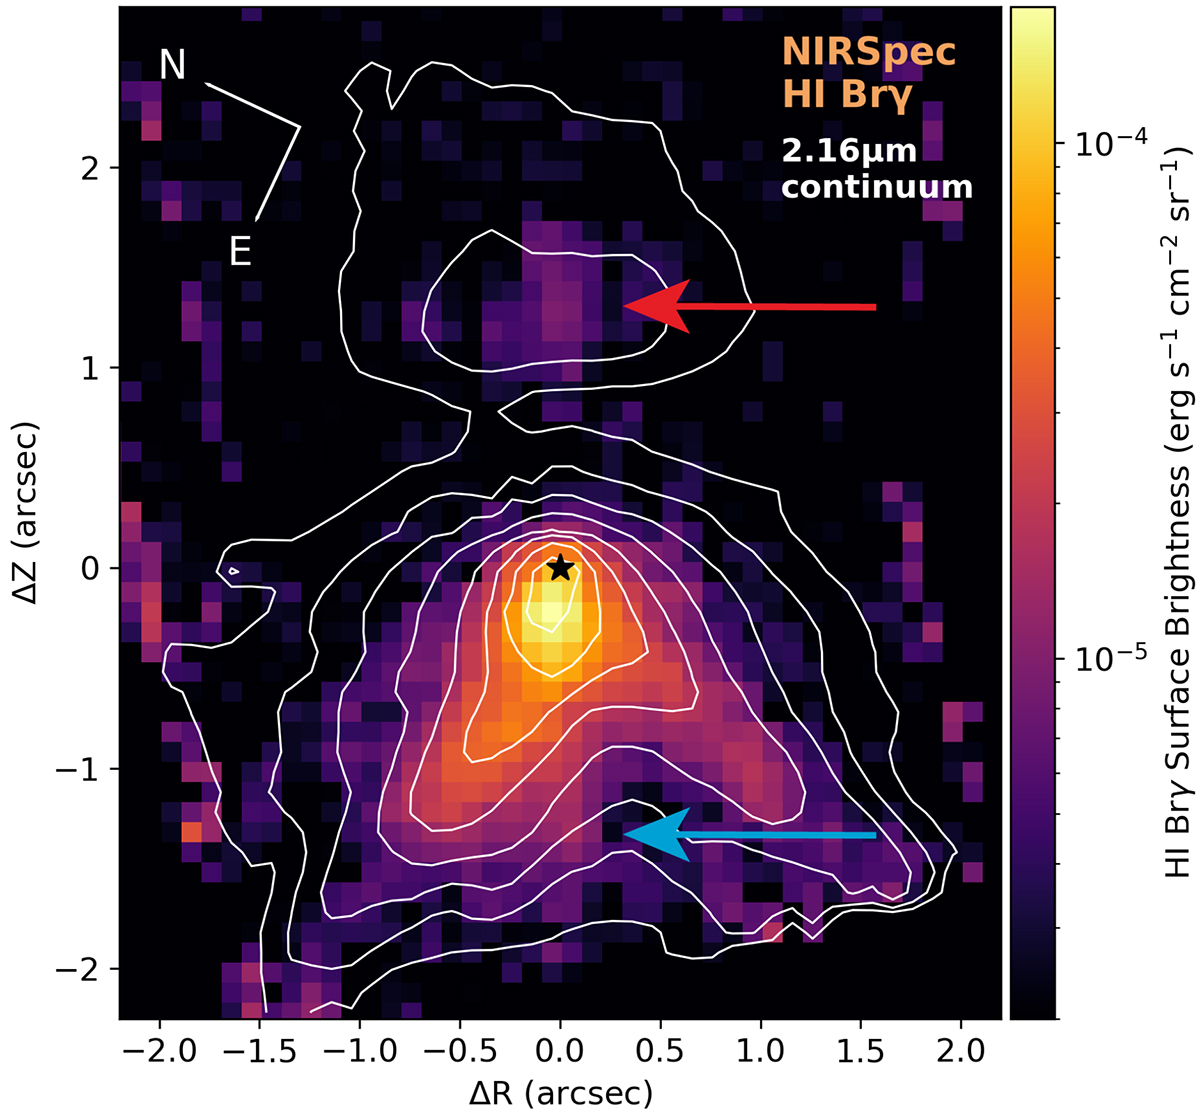
NIRSpec HIcontinuum-subtracted Brγ surface brightness map (color map). White contours plot the continuum near 2.16 μm. Contour levels start at 3σ (σ = 2.3 × 10⁻³ erg s−1 cm−2 μm−1 sr−1) and increase by factors of 2. The ALMA 232 GHz peak continuum position is represented with a black star. The red and blue arrows show the base of the redshifted and blueshifted jets respectively.
Current usage metrics show cumulative count of Article Views (full-text article views including HTML views, PDF and ePub downloads, according to the available data) and Abstracts Views on Vision4Press platform.
Data correspond to usage on the plateform after 2015. The current usage metrics is available 48-96 hours after online publication and is updated daily on week days.
Initial download of the metrics may take a while.