Fig. 6.
Download original image
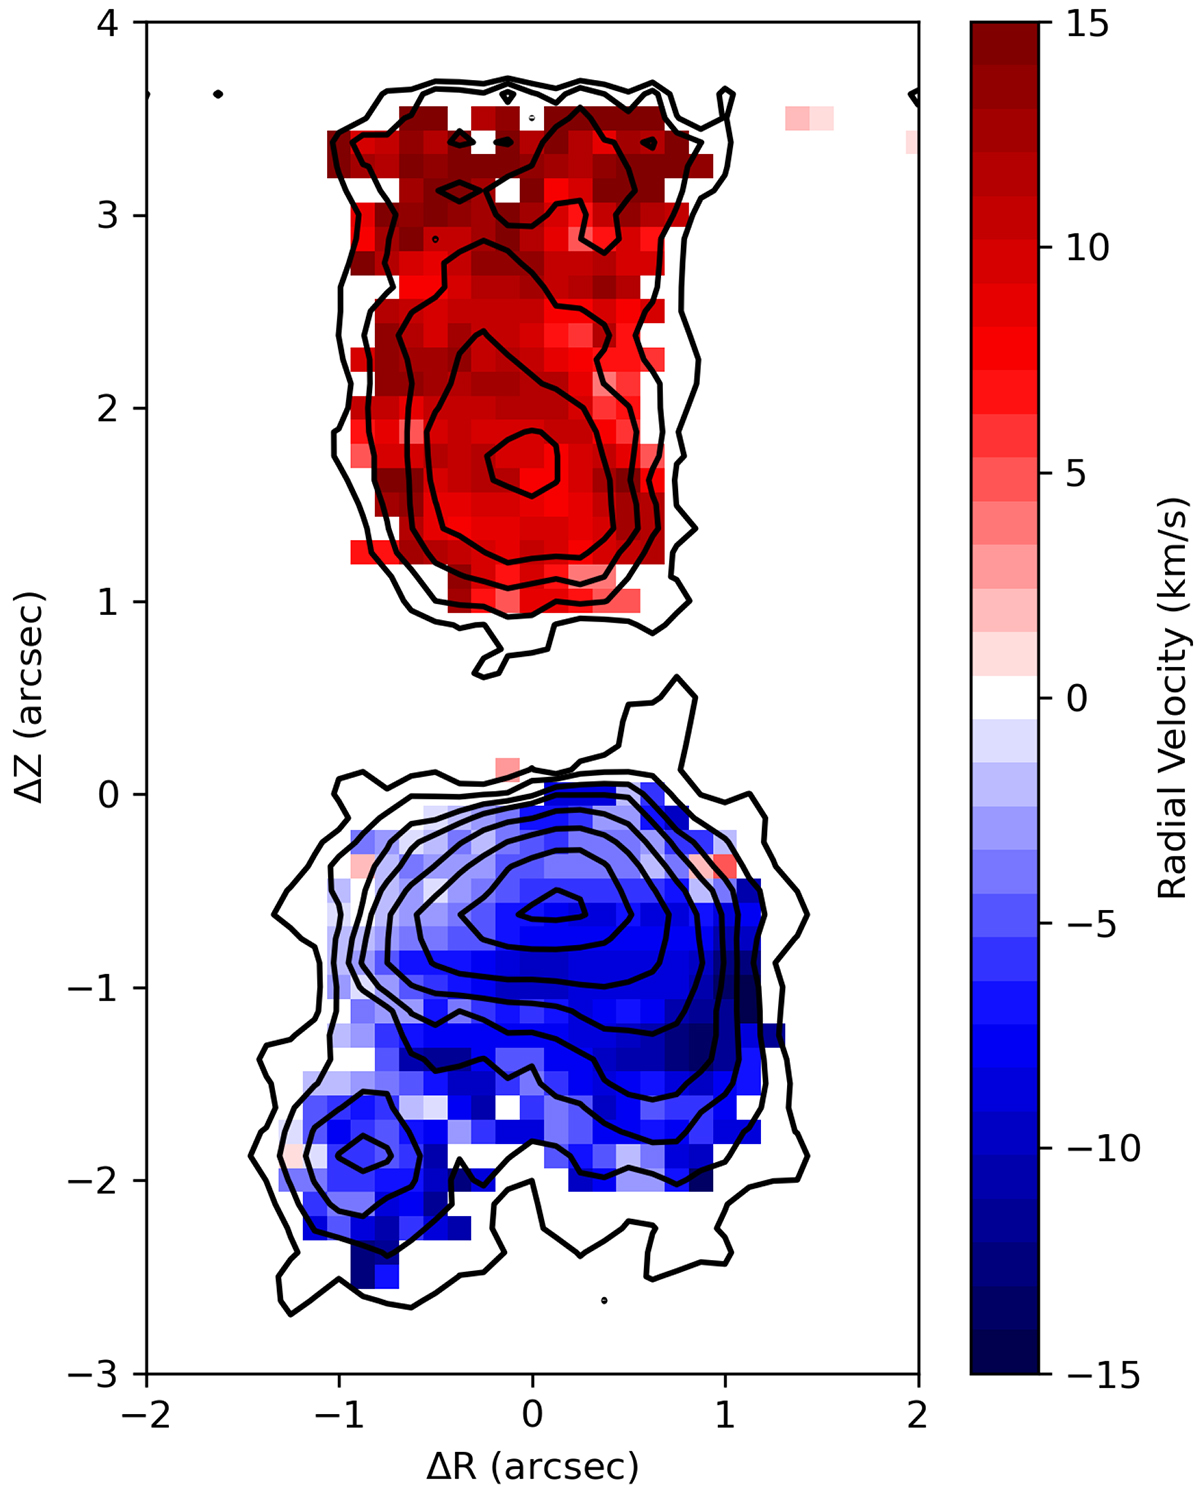
Map of H2 1−0 S(1) centroid velocities from SINFONI observations. Only values for which the S/N > 10 at the line peak are shown. The black contours represent the SINFONI integrated, continuum subtracted H2 1−0 S(1) surface brightness map. Contour levels are 3, 5, 8, 11, 17, 26, 38 and 50σ with σ = 4 × 10⁻⁶ erg s−1 cm−2 sr−1.
Current usage metrics show cumulative count of Article Views (full-text article views including HTML views, PDF and ePub downloads, according to the available data) and Abstracts Views on Vision4Press platform.
Data correspond to usage on the plateform after 2015. The current usage metrics is available 48-96 hours after online publication and is updated daily on week days.
Initial download of the metrics may take a while.