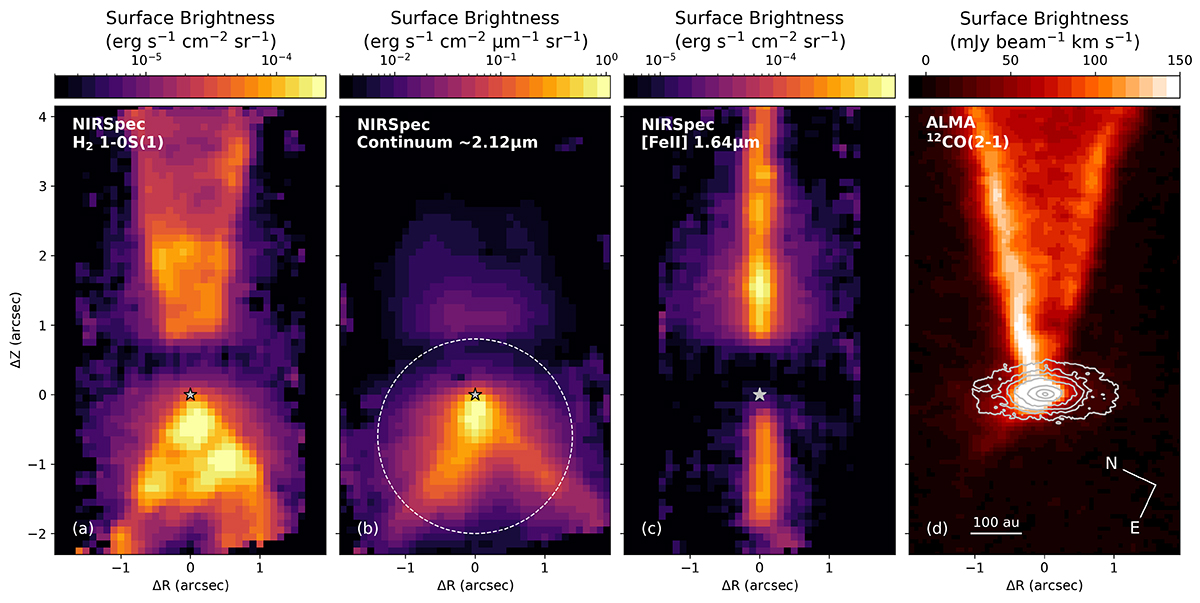
Fig. 4.
Download original image
NIRSpec and ALMA maps of DG Tau B outflows. Panel a: NIRSpec H2 1−0 S(1) λ2.12 μm integrated surface brightness map, continuum subtracted. Panel b: NIRSpec average continuum map estimated over a spectral width 1.8 × 10⁻² μm centered on the H2 1−0 S(1) line. The white dashed circle corresponds to the aperture used to extract the spectra from Fig. 3. Panel c: NIRSpec [Fe II] λ1.64 μm integrated surface brightness map, continuum subtracted. Panel d: moment 0 map of the 12CO(2−1) emission observed with ALMA, integrated between (V − Vsys) = +2.15 km s−1 and 8 km s−1. The contours of the ALMA disk continuum at 232 GHz are superimposed. Adapted from DV20. The gray star at offset (0, 0) marks the position of the disk continuum emission peak, considered to be the source position. The ΔZ axis points towards the redshifted jet at PA = 295°.
Current usage metrics show cumulative count of Article Views (full-text article views including HTML views, PDF and ePub downloads, according to the available data) and Abstracts Views on Vision4Press platform.
Data correspond to usage on the plateform after 2015. The current usage metrics is available 48-96 hours after online publication and is updated daily on week days.
Initial download of the metrics may take a while.