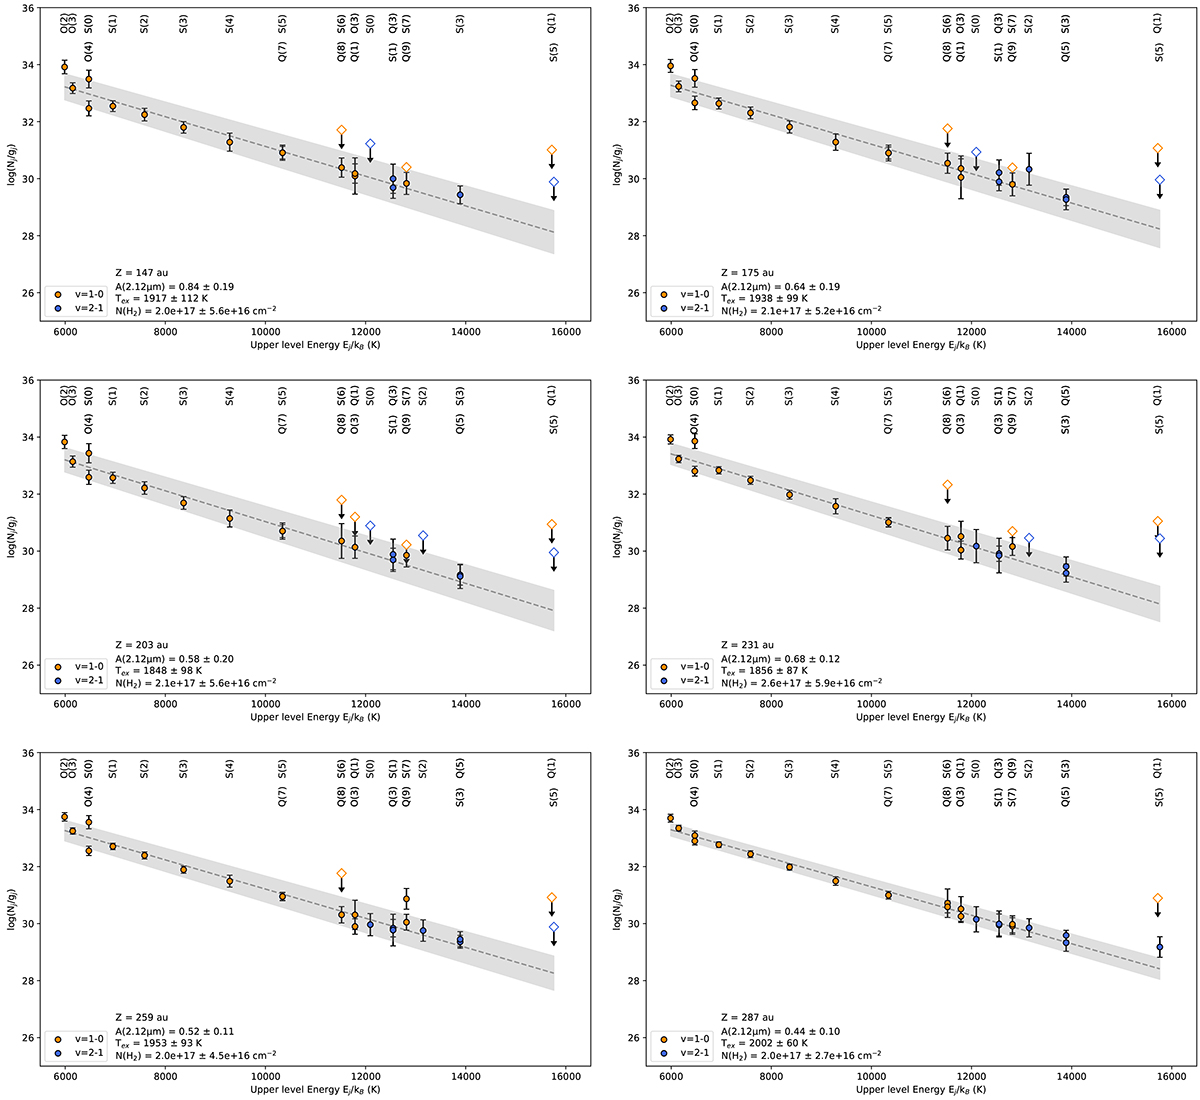
Fig. F.1.
Download original image
H2 excitation diagrams at various deprojected distances Z along the redshifted lobe. They are obtained in slits of width ΔZ = 0.2″ (=28 au). Rotational transitions are labeled at the top of each diagram and were dereddened using the mean extinction A2.12μm estimated from the 1-0Q(7)/1-0S(5) line ratio. v = 1 levels are plotted in orange and v = 2 in blue. The opened diamond symbols represent the 3σ upper limits of undetected H2 transitions. Error bars are at 1σ. The gray dashed line is the best fit to the points and the gray area shows the 1σ range. The text at the bottom of each panel gives respectively the deprojected distance Z, the mean extinction A2.12μm, the excitation temperature Tex and the hot H2 column density N(H2) derived from the fit parameters.
Current usage metrics show cumulative count of Article Views (full-text article views including HTML views, PDF and ePub downloads, according to the available data) and Abstracts Views on Vision4Press platform.
Data correspond to usage on the plateform after 2015. The current usage metrics is available 48-96 hours after online publication and is updated daily on week days.
Initial download of the metrics may take a while.