Fig. E.3.
Download original image
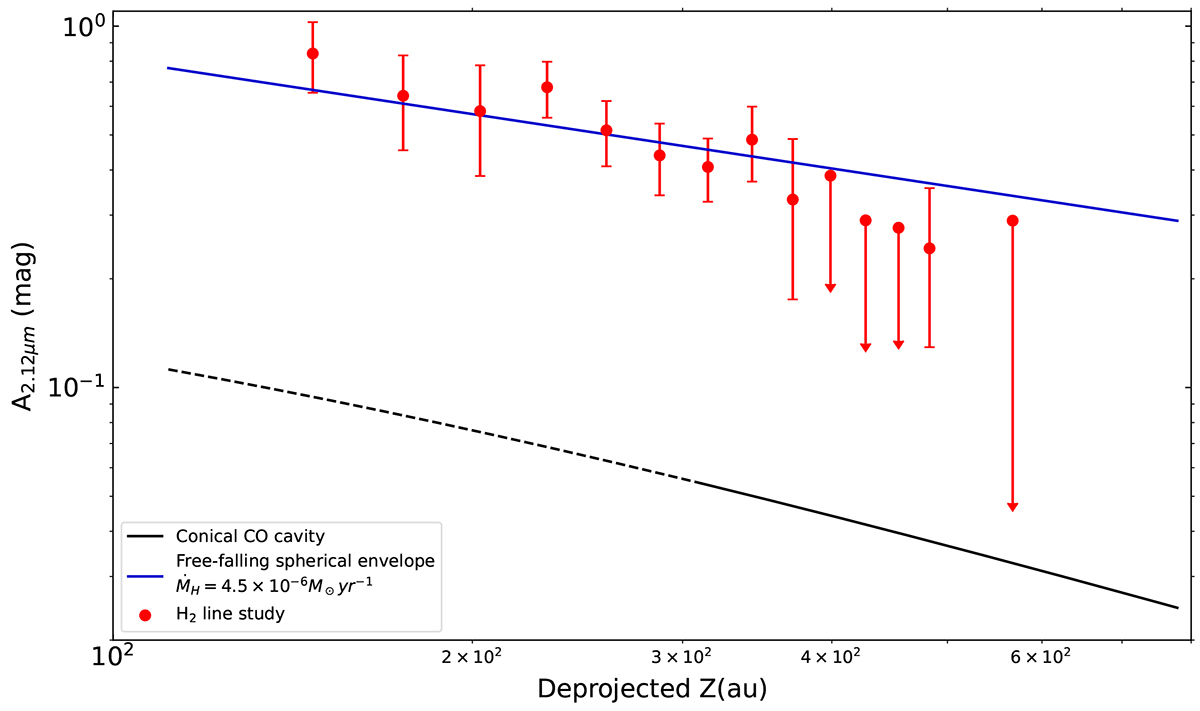
Predicted reddening variation along the DG Tau B redshifted lobe for the conical CO outflow and envelope. The red points are the extinction values estimated from the H2 ro-vibrational transitions in Sect. 4.3. The black curve shows the expected extinction at 2.12μm as a function of distance from the source due to the CO conical redshifted outflow using the mass flux estimated in DV20. The black dashed curve represents the extrapolation of the model below 300 au assuming a constant CO mass flux. The blue line corresponds to the extinction profile for a spherical envelope in free fall with an infall rate of 4.5 × 10⁻⁶ M⊙ yr−1.
Current usage metrics show cumulative count of Article Views (full-text article views including HTML views, PDF and ePub downloads, according to the available data) and Abstracts Views on Vision4Press platform.
Data correspond to usage on the plateform after 2015. The current usage metrics is available 48-96 hours after online publication and is updated daily on week days.
Initial download of the metrics may take a while.