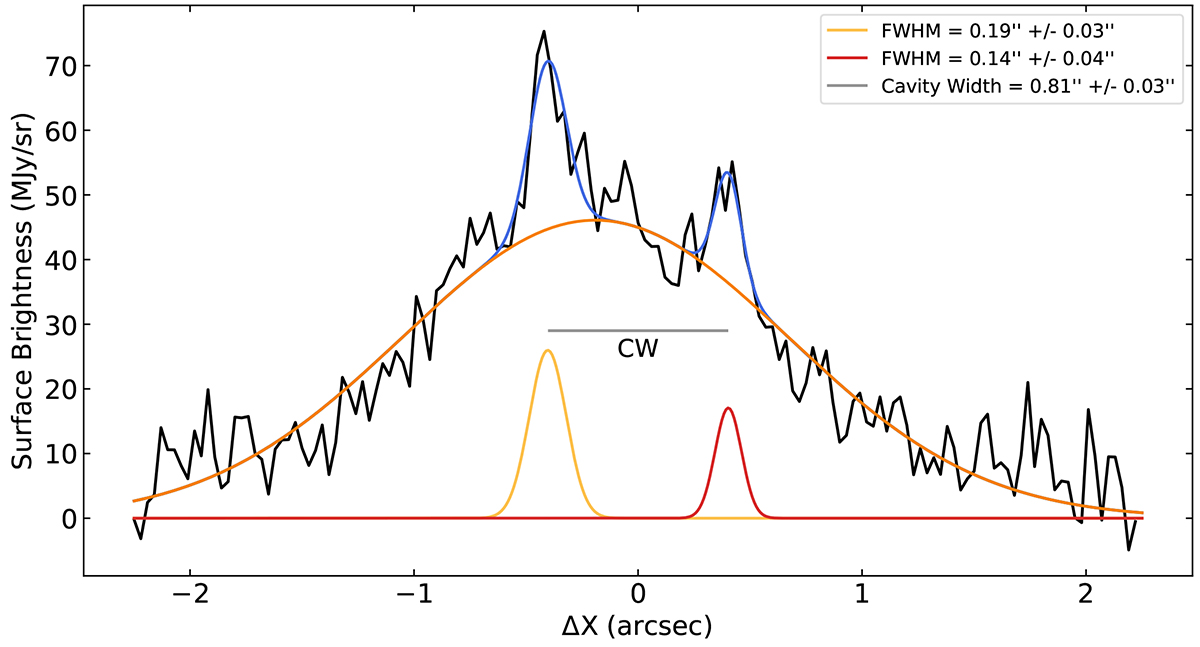
Fig. C.1.
Download original image
Measure of the H2 cavity thickness from the NIRCam images. The black curve shows the transverse intensity profile perpendicular to the axis of the redshifted H2 cavity measured on the NIRCam F212N image at ΔZ = 1.5″. The blue curve corresponds to the fit of the profile by a combination of 3 Gaussians. The red and yellow curves are the individual Gaussians fitting the two intensity peaks associated with the bright edges of the cavity. The orange curve corresponds to the fit of the wide baseline component. The gray line, called "CW" for Cavity Width, shows the separation between the two Gaussian center positions.
Current usage metrics show cumulative count of Article Views (full-text article views including HTML views, PDF and ePub downloads, according to the available data) and Abstracts Views on Vision4Press platform.
Data correspond to usage on the plateform after 2015. The current usage metrics is available 48-96 hours after online publication and is updated daily on week days.
Initial download of the metrics may take a while.