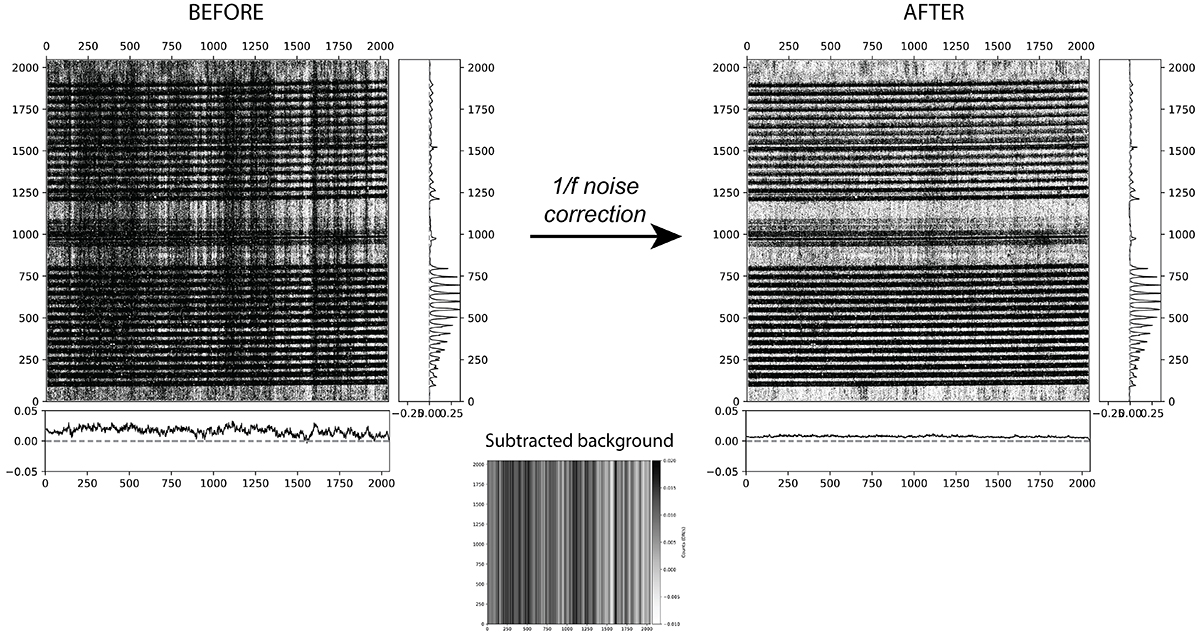
Fig. A.1.
Download original image
Illustration of the 1/f noise correction. Example of an image from NIRSpec NRS2 detector before (left) and after (right) correction for 1/f correlated noise. The box to the right of each image plots the median values of each horizontal slit in the image. The boxes at the bottom show the median values of each vertical slit in the image. The smaller image in the middle corresponds to the map of mean values subtracted from the initial image.
Current usage metrics show cumulative count of Article Views (full-text article views including HTML views, PDF and ePub downloads, according to the available data) and Abstracts Views on Vision4Press platform.
Data correspond to usage on the plateform after 2015. The current usage metrics is available 48-96 hours after online publication and is updated daily on week days.
Initial download of the metrics may take a while.