Fig. 10.
Download original image
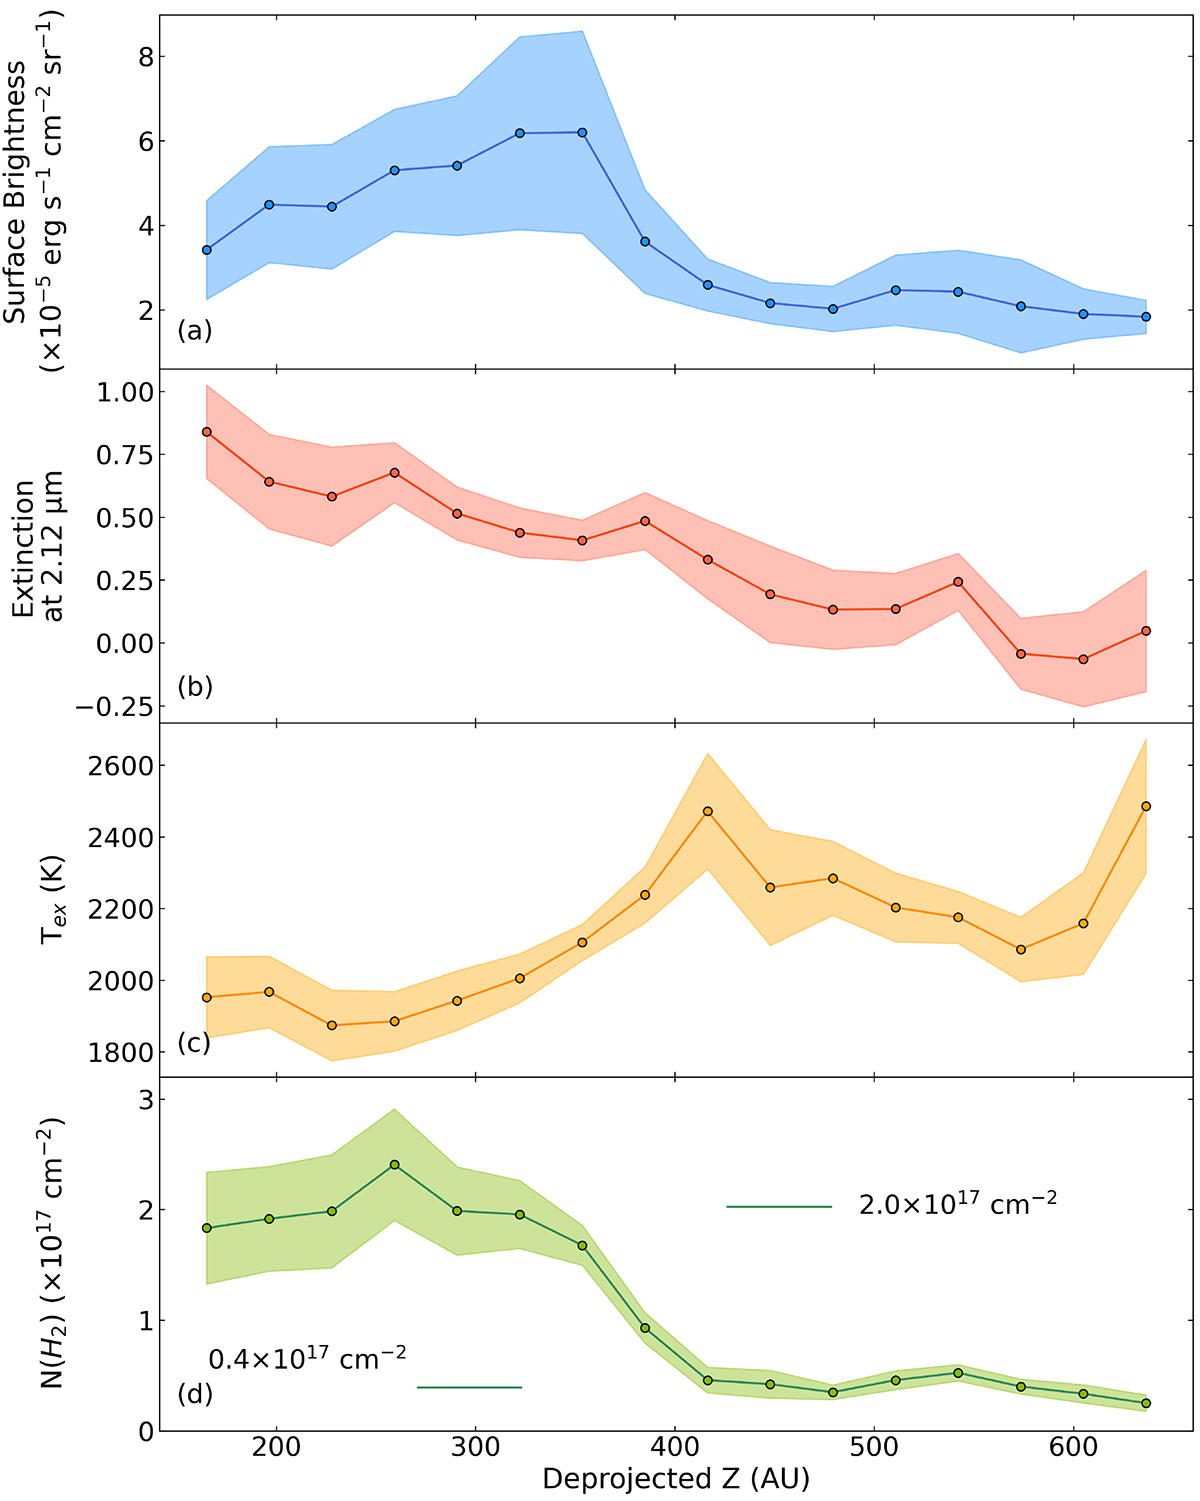
H2 excitation conditions along the redshifted lobe axis. Panel a: surface brightness of H2 1−0 S(1) averaged across the lobe, not corrected for extinction, as a function of deprojected distance from the source. Panel b: average extinction at 2.12 μm obtained from the line ratio H2 1−0 Q(7)/1−0 S(5) (see text). Panel c: H2 excitation temperature obtained by fitting the excitation diagram. Panel d: H2 column density calculated from the same excitation diagrams (see Appendix F).
Current usage metrics show cumulative count of Article Views (full-text article views including HTML views, PDF and ePub downloads, according to the available data) and Abstracts Views on Vision4Press platform.
Data correspond to usage on the plateform after 2015. The current usage metrics is available 48-96 hours after online publication and is updated daily on week days.
Initial download of the metrics may take a while.