Fig. 5
Download original image
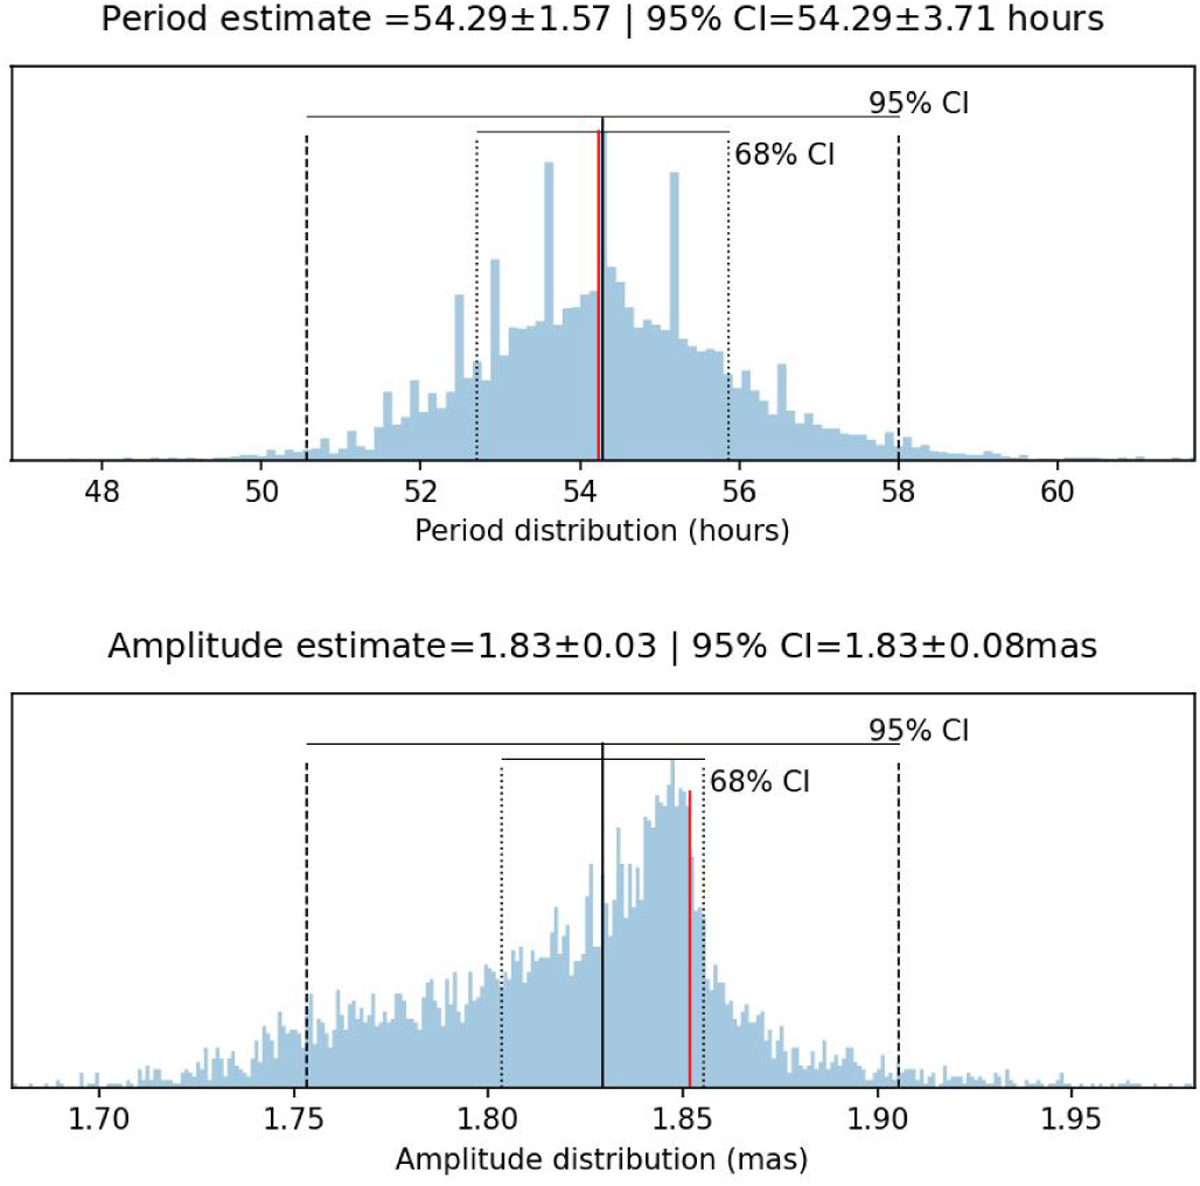
Examples of uncertainty determination from MC simulations under ![]() . The top and bottom plots show, respectively, the distribution of periods and amplitudes obtained from the best fit in each MC simulation (in blue). The red lines show the value estimated from the first GLSP run only on Gaia data, and the solid black line represents the median obtained from the distribution of amplitude and period values from the MC under
. The top and bottom plots show, respectively, the distribution of periods and amplitudes obtained from the best fit in each MC simulation (in blue). The red lines show the value estimated from the first GLSP run only on Gaia data, and the solid black line represents the median obtained from the distribution of amplitude and period values from the MC under ![]() . The dotted vertical lines show the 68% distribution interval while the dashed lines represent the 95% confidence interval of the distribution. The final results are given as the first estimate from the Gaia data (red line), and the uncertainty is the 95% interval. For instance, in this example, the final amplitude value is 1.85 ± 0.08.
. The dotted vertical lines show the 68% distribution interval while the dashed lines represent the 95% confidence interval of the distribution. The final results are given as the first estimate from the Gaia data (red line), and the uncertainty is the 95% interval. For instance, in this example, the final amplitude value is 1.85 ± 0.08.
Current usage metrics show cumulative count of Article Views (full-text article views including HTML views, PDF and ePub downloads, according to the available data) and Abstracts Views on Vision4Press platform.
Data correspond to usage on the plateform after 2015. The current usage metrics is available 48-96 hours after online publication and is updated daily on week days.
Initial download of the metrics may take a while.