Fig. 4
Download original image
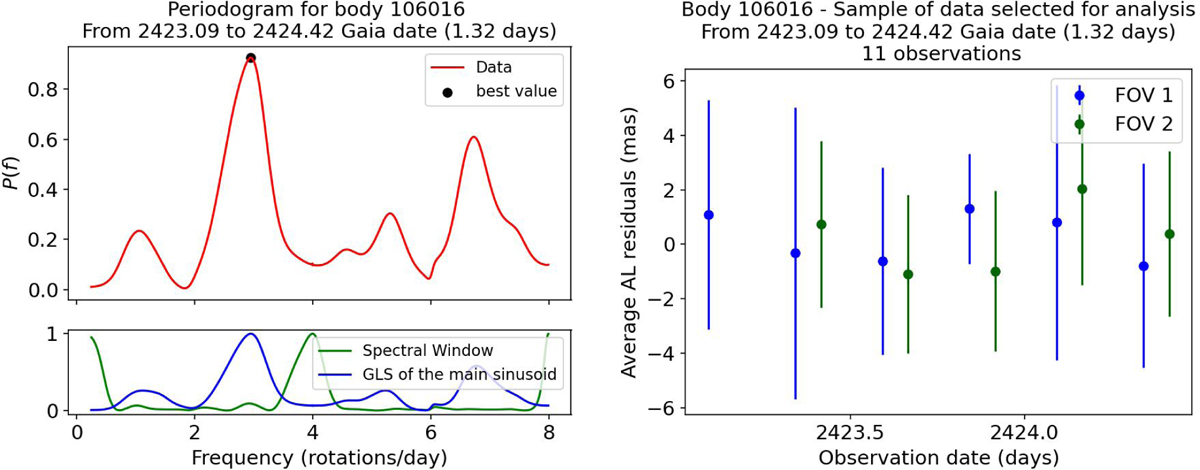
Examples of periodograms obtained for asteroid (106016) 2000 SS293 (left plot), with residuals shown on the right plot. The y-axis shows the GLSP P(f) for each frequency shown on the x-axis. The red line represents the periodogram obtained for the data analysed. The blue line represents the GLSP obtained for a purely sinusoidal signal whose parameters correspond to the largest peak of P(f) (about 3 cycles per day here), with the same time sampling as the data and the same error bars for the weights. Finally, the green line represents the spectral window of the time sampling. The right plot shows the AL residual time series that reproduces the periodogram on the left plot.
Current usage metrics show cumulative count of Article Views (full-text article views including HTML views, PDF and ePub downloads, according to the available data) and Abstracts Views on Vision4Press platform.
Data correspond to usage on the plateform after 2015. The current usage metrics is available 48-96 hours after online publication and is updated daily on week days.
Initial download of the metrics may take a while.